
In the Far Field
Mississippi ~ PERS 2025 Annual Comprehensive Financial Report, Massive Investment Gains of 2021, Unexpected Mortality ... & A New Life Insurance Source

.
.
“I’m a former public employee that did not want to put an experimental drug into my body just to keep my job. That experience has probably scarred me for life. I am now looking at public institutions, state by state, to see if there is any potential (official) evidence of harm caused by those coerced covid vaccinations.
.
I am now 100% convinced that there were harms, and my data shows that clearly.
Moving forward, I am currently looking for any signs that the injuries are still happening - specifically, do we see a trend of elevated health impacts above any pre-pandemic norms? Because by this time, any supposed “benefits” to be had from the safe and effective “covid” vaccines should have kicked in and made everything normal again.
Right?
.
***If there are terms that you come across that you need explained, try consulting my pension glossary.***

I was in the middle of putting together this Mississippi post when I stumbled across some new life insurance data - you see, I was trying to figure out why Wisconsin was pretty much the only state where I had seen life insurance numbers included in the pension report. It would seem that they are unique … in that the state itself provides the life insurance and is then obligated to report the numbers. Almost all other states farm out the life insurance of their members to private providers which have no detailed disclosure requirements.
.
But what if the one-off of Wisconsin with its lone example of including life insurance statistics could somehow be duplicated for all our states?
.
I may be able to do just that.
.
But it will be at the very end of this post.
.
.
.
Public Employees’ Retirement System of Mississippi
2025 Annual Comprehensive Financial Report
A Component Unit of the State of Mississippi
.
.
.
The Big Payday

page 55 (Schedule of Investment Returns)

.
!!! Mississippi made the 30% club !!!
That is really something.
.
.
.
page 74 (Total Pension Investment Rates of Return)
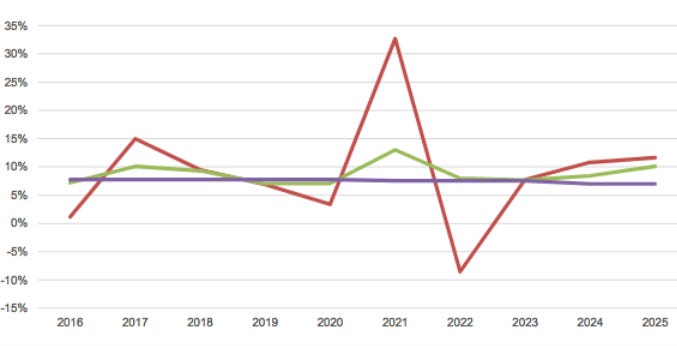
***watch that red line and the “taketh” that happens in 2022!***
.
.
.
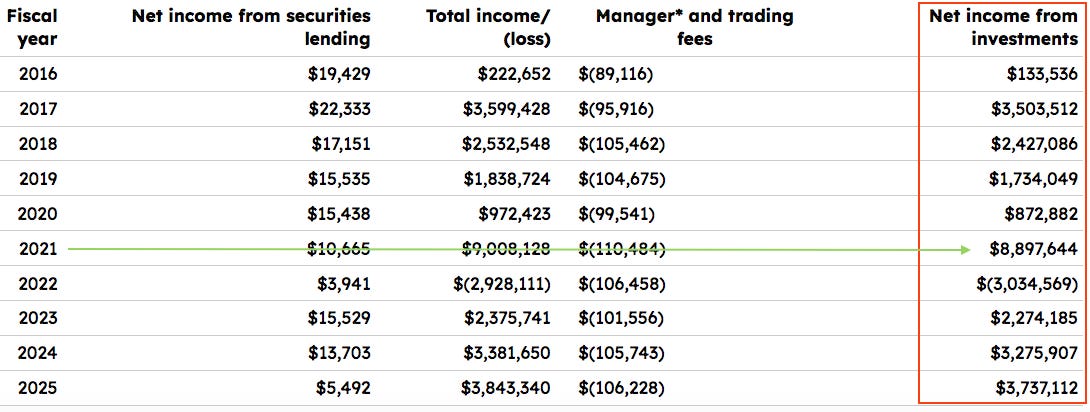
page 75 (Net Investment Income by Source ~ In Thousands)
.
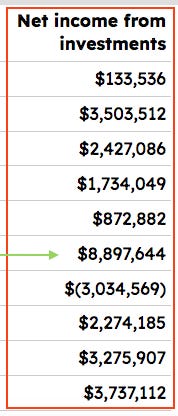
A little closer:
.
So Mississippi did really good there in 2021 where the green arrow is. That is almost exactly 8 billion dollars in investment gains from 2020 (the one above the arrow) to 2021.
.
.
.
Unexpected Mortality

***Wow, so the last time I looked at this Mississippi pension system report I was not even making graphs yet!
Guess I gotta make one now … bear with me, I am using my ancient laptop to do these latest posts, and that is why some of the graphics look a little different.
.
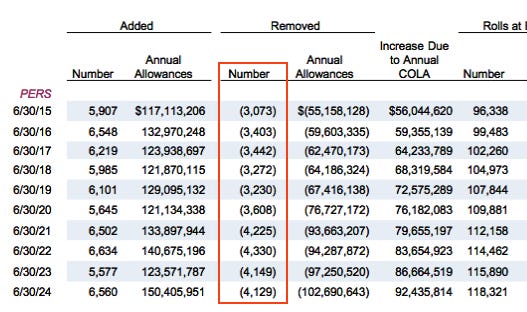
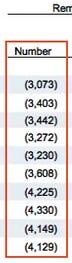
page 123 (Schedule of Retirants Added to & Removed from Rolls)
*(this will only use the first main group table for PERS)
.
A little closer:
.
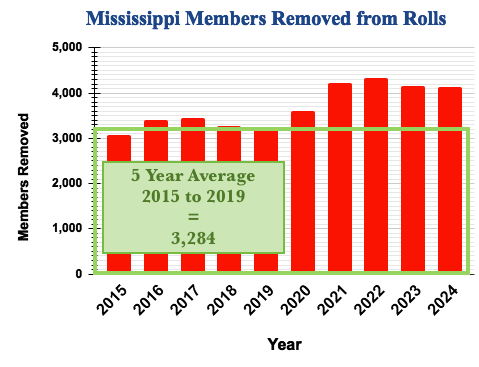
***So why are all the “with-vaccine” yearly bars larger than 2020, the “no-vaccine” year? Was that what we were promised? Does that make any sense if what they said was true?
.
.
.
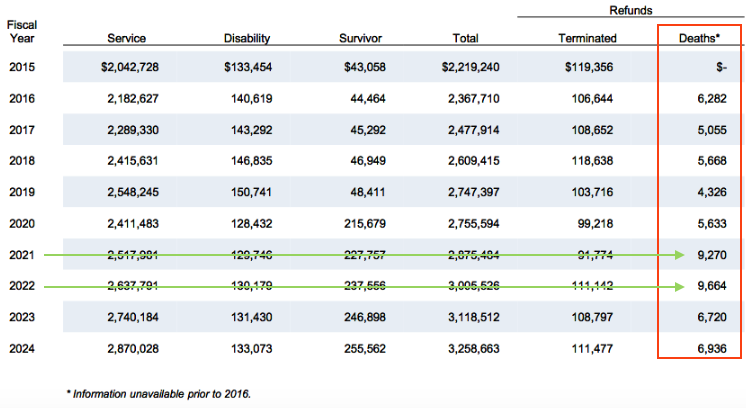
page 130 (Benefit & Refund Payments by Type: PERS ~ in thousands)
.
A little closer:
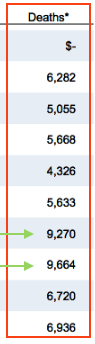
Okay, so these are the death refunds for the PERS group. And we all know by now that this is a payout for when a member dies before retiring. Our green arrows are pointing at 2021 and 2022.
So the pre-pandemic average for these payouts was running at $5,332,750.
2020 was a little higher than that, but 2021 and 2022 were nearly doubling that average. Thankfully those very noticeable highs went back down in 2023 and 2024, but even those were still well above the average … and significantly higher than the “no-vaccine” year of 2020.
.
***Now an astute reader may be scanning the other columns on that table and notice an alarming increase in Survivor payouts that kicked in from 2019 to 2020.
.
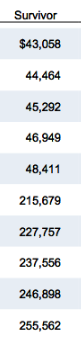
That is indeed a very big jump in those numbers. After some research into the matter though, I understand that Mississippi’s pension system just happened to conclude an “experience study” at that time, which then adjusted certain numbers. That is what happened to that category. But it seems that the death refunds were not similarly affected, at least that is my take.
So I do not think we will be able to discern too much from those survivor numbers.
.
.
.
Now I am going to circle back to some earlier pages in the report that I skipped over. Some of you readers that have been with me for a while will be familiar with actuarial gain and loss tables. I have compared these to bookie’s ledgers in the past, so that implies that it is all guessing. And truly it is, in a way, but informed. The actuaries job is to look at trends and plan the future based on those. They can’t foresee such things as pandemics - and you would expect to see that show up in their guesswork around the time of “covid”, right?
Let’s take a look.
.
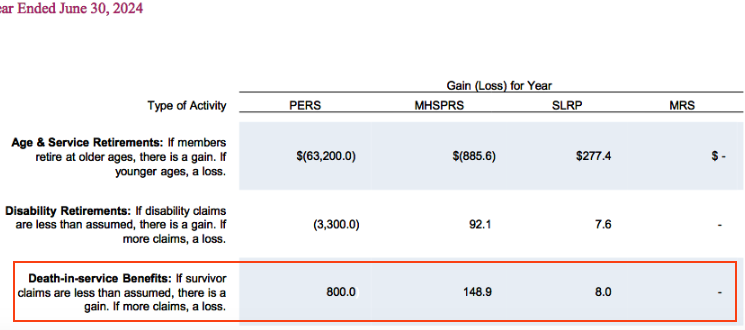
page 121 (Analysis of Financial Experience Gains & Losses in Accrued Liabilities Resulting from Differences Between Assumed Experience & Actual Experience ~ in thousands)
*(I have taken the liberty of making a cropped composite of the two relevant categories on the table: Died-in service Benefits and Death After Retirement.)
2025

.
I apologize for getting into this confusing area here at the end, but it needs to be archived. I will just remind you that these two categories represent increased mortality in opposite ways on this (and most) report(s). The explanatory statement for died-in-service says: “If survivor claims are less than assumed, there is a gain. If more claims, a loss.” And the statement for death after retirement says: “If retirants live longer than assumed, there is a loss. If not as long, a gain.”
Losses are in parentheses on this table. So both categories here are representing gains in the main PERS group. That means that only the retired members saw more than expected mortality in 2024, the active folks died less than they thought. Half good.
And to be clear, that retired figure is in thousands, so it is saying that they miscalculated the extra deaths to the tune of 9 million dollars.
.
But we have to do the tedious work now of going back to the past reports and look at these same tables to try and discern any pattern. As we go through them, keep in mind that the years are staggered … the 2024 report gives you the data for fiscal year ending June 30, 2023 … and so on.
.
2024

*So here we are seeing more than expected deaths in each category for the PERS group. The died-in-service number in this year is a loss and the retiree figure is a gain … $16,500,000!
But that active member death loss is also very troubling. It is my understanding that there should not be significantly large numbers in this category, since young active members rarely die and the actuaries base their assumptions on long held trends. Seeing this go either direction in the millions of dollars is not the norm.
.
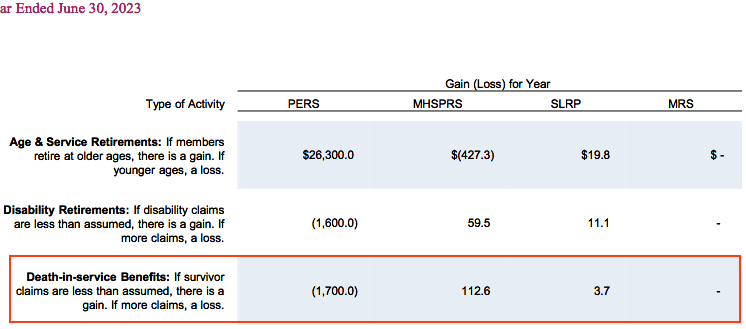
2023

*Yikes! Both are again showing unexpected mortality. And the numbers are much larger in each category … the largest yet.
.
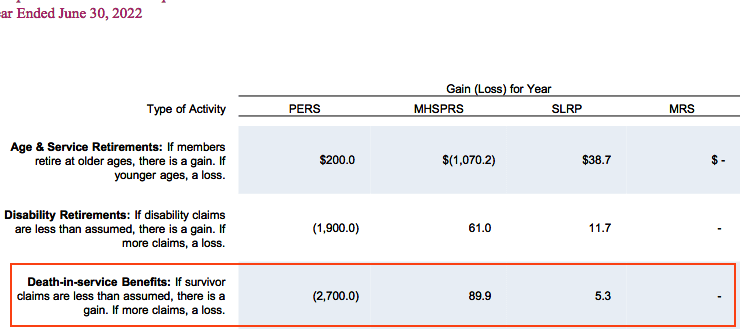
2022

*Not good. Both categories indicate unexpected deaths yet again. And just look at the figure for the retiree deaths! It has grown to the biggest excess yet … $72,900,000.
.
2021

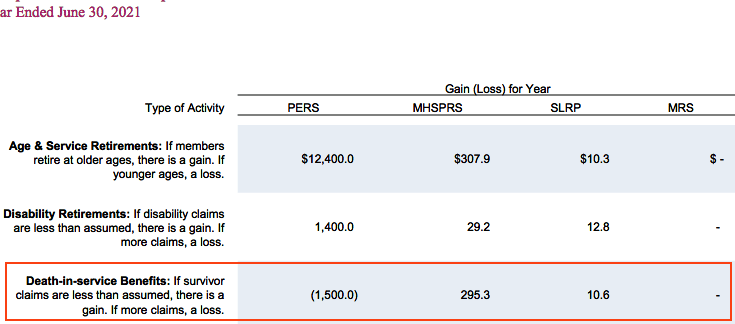
*Now this is an interesting one. Notice that this died-in-service (active workers) number for PERS is still showing one of the highest unexpected death results here at the end of June in 2020. BUT the death after retirement figure for PERS is not a gain, it is a fairly big loss. That means less retirees died than expected in the first six months of 2020.
What the hell?
.
2020

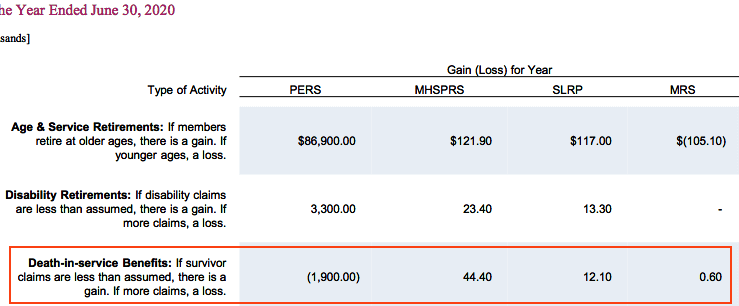
*So here we are in the year before the pandemic and there still is a moderate sign of some elevated mortality in the active members. And perhaps as we would assume, the retiree members are showing no extra deaths in this timeframe, it is the opposite - they seem to be living longer than expected here. That’s good.
.
2019

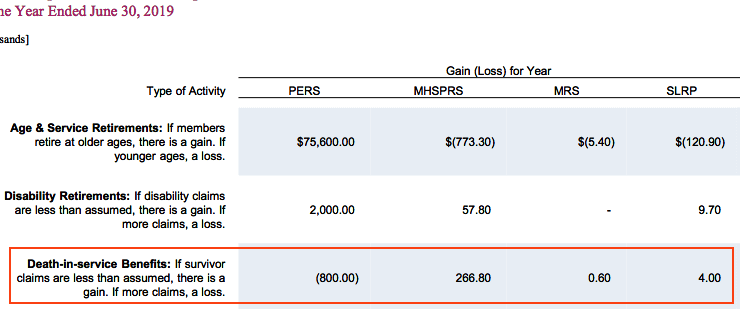
*So this is showing a good result for the died-in-service PERS number - less extra mortality. But the retiree number is now back to extra death indication, but not as high as some of the results in those later years we have seen above.
.
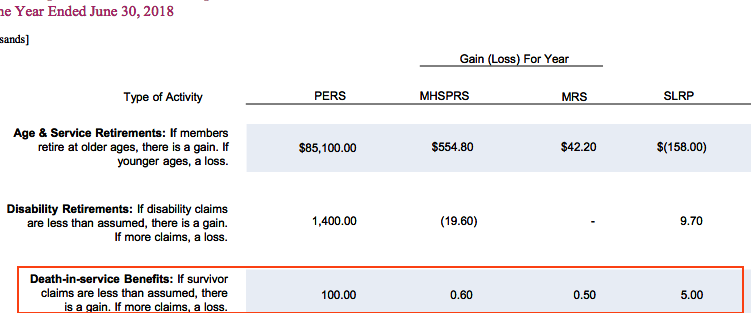
I am going to stop here with the dig in the archive, there is a glitch in the reports where they give the same table we just looked at (for some reason) in the 2018 document, not the 2017 numbers as we would expect. But I think you can see a definite event that is echoed in the progression. Something that is not easily attributed to just “covid” - for if it was only the pathogen causing havoc, then the miracle drug would have erased any elevated deaths at least by 2022 … right?
But as I wrap this portion of our investigation up I would ask you to go back up and look at something I only just noticed myself. For the numbers ending June 30th in 2022, 2023, and 2024 take notice of the Disability Retirement numbers.
This is the explanatory note for that: “IF DISABILITY CLAIMS ARE LESS THAN ASSUMED, THERE IS A GAIN. IF MORE CLAIMS, A LOSS.”
They are all showing more than expected figures in that category. 2024 as the biggest yet.
2022 … a $1,900,000 loss.
2023 … a $1,600,000 loss.
2024 … a $3,300,000 loss.
Not good.
.
.
.
Okay so now let us get to that new life insurance stuff I said I had to show you.
.
.
.

The life insurance industry is home to the nation’s most trusted and iconic household financial protection brands.
The American Council of Life Insurers (ACLI) advocates on behalf of these 275 member companies whose products and services help 90 million American families achieve financial security.
.
So this is it. The American Council of Life Insurers (ACLI) has a thing called the Life Insurers Fact Book which provides statistics and information on trends in the life insurance industry. Specific topics covered include assets, liabilities, income, expenditures, reinsurance, life insurance, and annuities.
A very nice research assistant told me about this resource and that it had state level data on how much money was paid out to beneficiaries each year. So just for today we will look at the Mississippi numbers. But rest assured, we are going to use this to cover the entire country before we are done.
.
.
.
ACLI Reports
.






















.
.
.
And the graph made from all those numbers (using the total column):
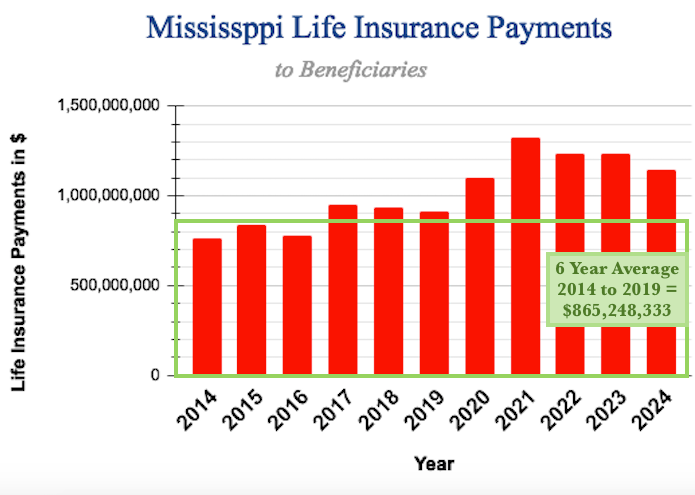
*So 2021 had the biggest number for life insurance payouts in Mississippi, which should not surprise us … maybe. The ACLI yearbooks are using a calendar year for the data, strictly January through December stuff here. It may take until the following year to see some life insurance payouts to show on the books. This may be why even though 2020 is noticeably higher than the previous years, it still is smaller than 2021. But here’s the thing … 2020 is also smaller than 2022, 2023 and 2024!
When the hell do we get to see those damn safe and effective shots start to work?!
.
And speaking of work - one last detail to consider. Please go back up and look at the subcategory for Group, these will be showing the life insurance payout data for employees that were still working and covered by their employer.
2014 … $242,468,000
2015 … $232,190,000
2016 … $233,162,000
2017 … $268,679,000
2018 … $268,069,000
2019 … $258,140,000
2020 … $309,085,000
2021 … $378,813,000
2022 … $345,194,000
2023 … $456,390,000
2024 … $337,445,000
.
Okay, those payouts went up in 2020, we were at around a $250,000,000 average pre-pandemic. But do notice that ALL the years past 2020 are bigger than it … and the very disturbing number that we see for 2023.
Well past the time where the miracle cure should have kicked in.
.
.
.
(that’s a wrap … sorry for the bummer stuff, yet again)
.
.
.
*in case you have forgotten …
Pandemic Milestones:
January 20, 2020
-First covid case in the U.S.
December 11, 2020
-Pfizer Emergency Use Authorization
December 18, 2020
-Moderna Emergency Use Authorization
August 23, 2021
-Pfizer full FDA approval
December 2021 / January 2022
-CDC and FDA revise booster recommendations
-Rapid booster uptake
January 31, 2022
-Moderna full FDA approval
August 31, 2022
-FDA authorized Pfizer and Moderna’s new bivalent COVID booster vaccines
April 10, 2023
-Biden declares the end of the pandemic
.
.
.
Thank you David. I still have much to learn about how these things are handled, but I do believe that those two areas are isolated, at least officially, on the ledger. The investment performance does not have a direct tie to employee benefits or staffing issues, I think.
But I do appreciate your thinking this through with me.
You have uncovered some really telling information here. All very sad though, these are real people.