
My Backyard
*


.
.
.
As I promised at the end of my last post, we are going to travel around the landscape with our picture frame that we are calling The Pandemic Window.
Being a Pacific Northwesterner myself, I thought we might start with a look around the state of Washington.
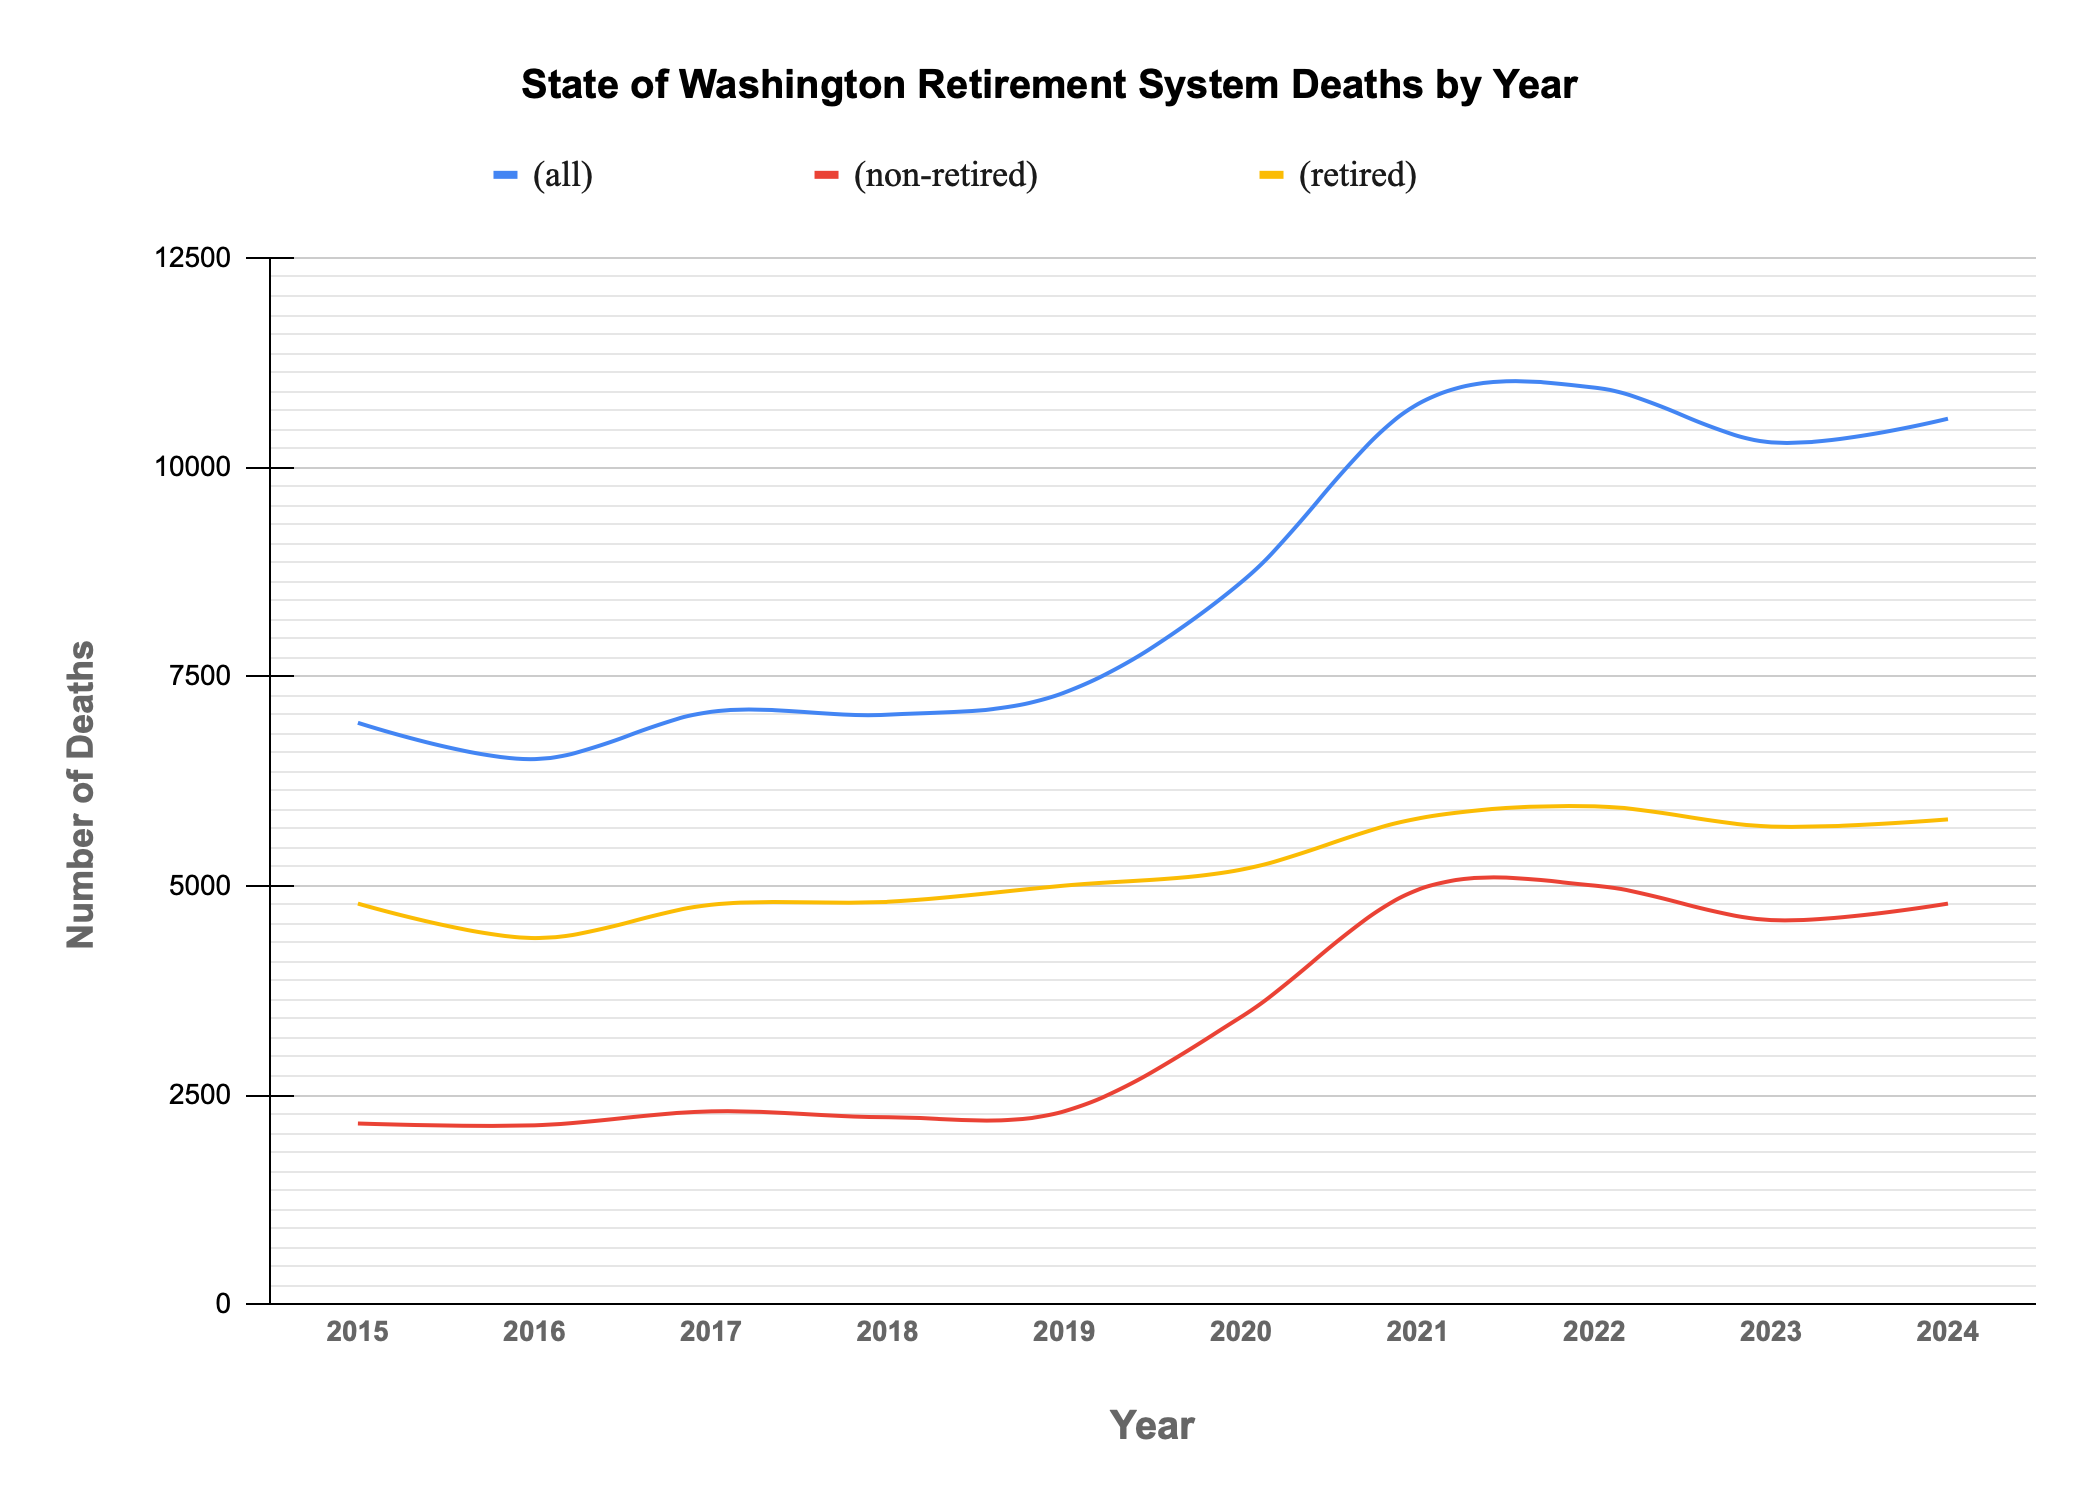
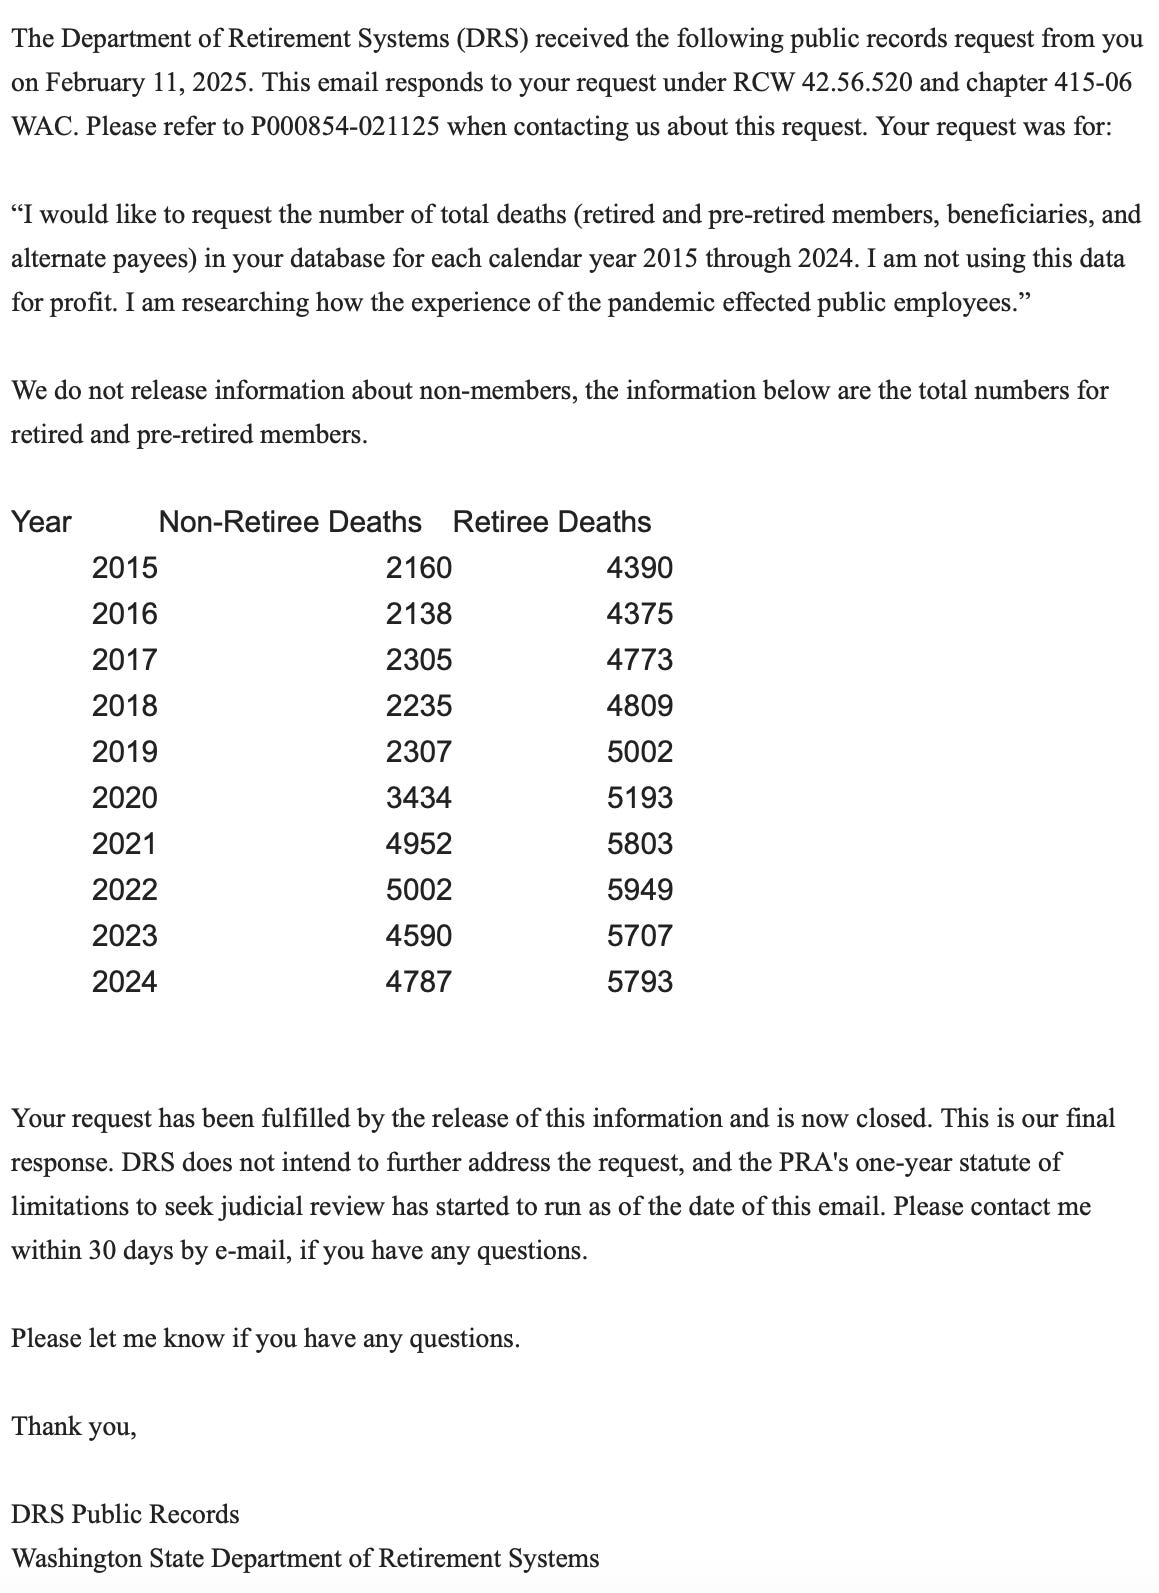
It just so happens that recently I tried my hand at another public records request. It was to Washington’s public retirement system, asking for the number of its members that had died in each calendar year from 2015 through 2024. The response I received conveniently separated the numbers into non-retired and retired members. I am assuming that “non-retired” simply means they were still working at the time of their death.
.
.
As you can see, even though the retired deaths (yellow line) do increase gradually above 5000 between 2019 and 2021, it is the non-retired / still working (red line) that really jumps in that time period.
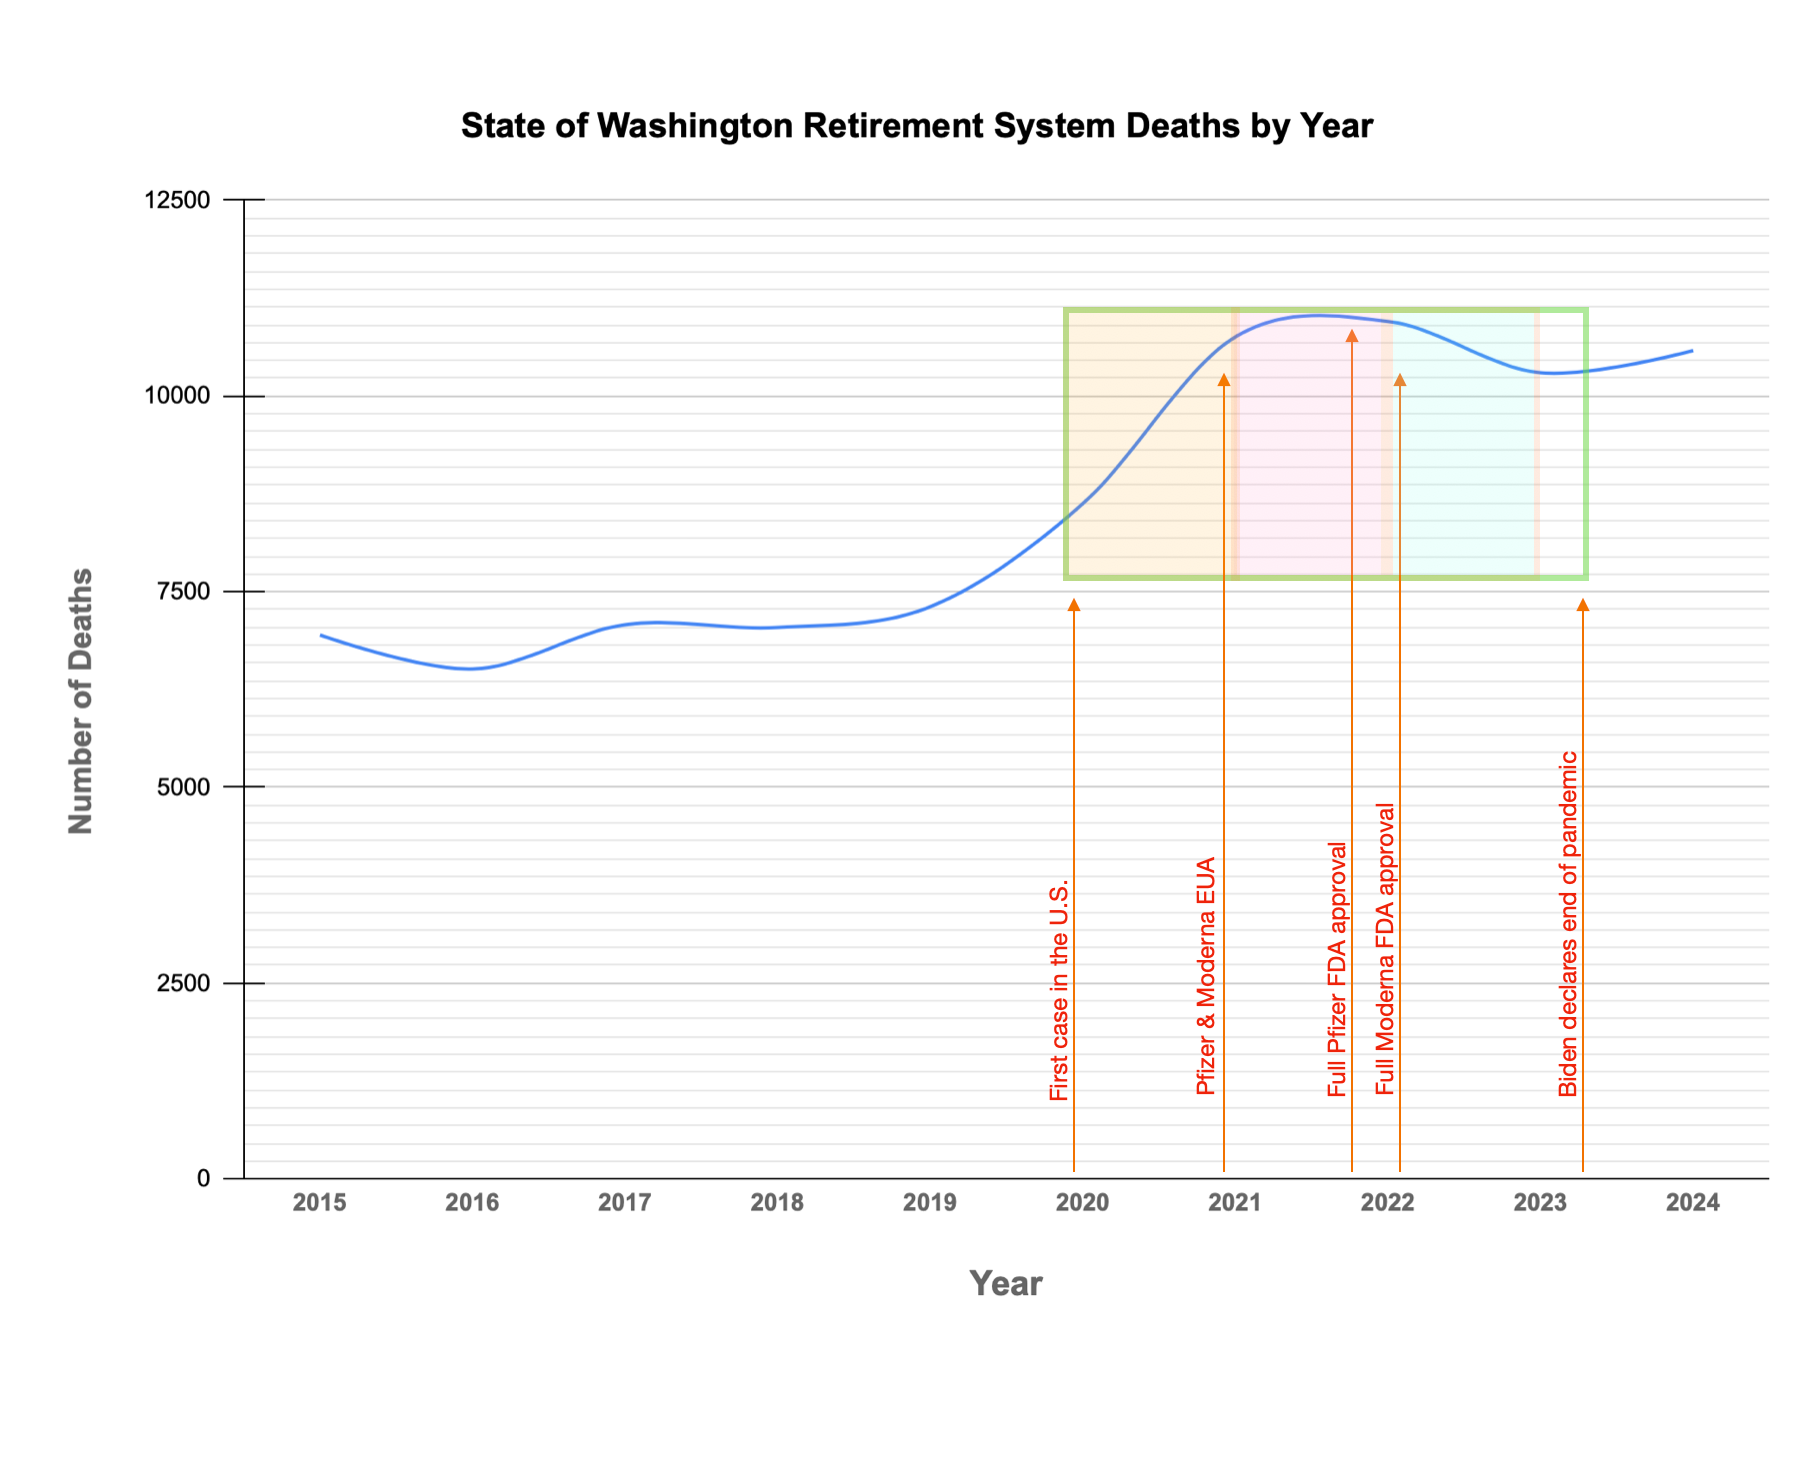
Having seen that distinction, let us now apply The Pandemic Window (green box) to just the all members data (blue line).
.
.
Now let’s apply the same cutting up of the window into three equal sized panes:
2020 to 2021 … the “no vaccine” pandemic year (yellow square)
2021 to 2022 … the 1st “with vaccine” pandemic year (pink square)
2022 to 2023 … the 2nd “with vaccine” pandemic year (light blue square)
.
.
The first pandemic “no vaccine” year (2020) has 8627 total retiree deaths.
The first pandemic “with vaccine” year (2021) has 10,755 total retiree deaths.
The second pandemic “with vaccine” year (2022) has 10,951 total retiree deaths.
.
I will now call your attention back to the first graph and how the numbers were separated for non-retired and retired members. The still working members that died (red line) are the ones that were hit hardest in The Pandemic Window. Any reasonable assessment of that fact will be that these were younger people that died, in larger numbers, as the pandemic progressed.
.
.
.
Here is the correspondence I received, with the numbers:
.
.
.
.
External Links:
CDC timeline of the pandemic
(Pfizer & Moderna EUA dates, Pfizer full FDA approval date & Moderna full FDA approval date)
.
*** UPDATE 7/1/25 ***
As this was one of the first posts, I am attempting to bring it in line with the later reports in regard to online sources that were not included.
.
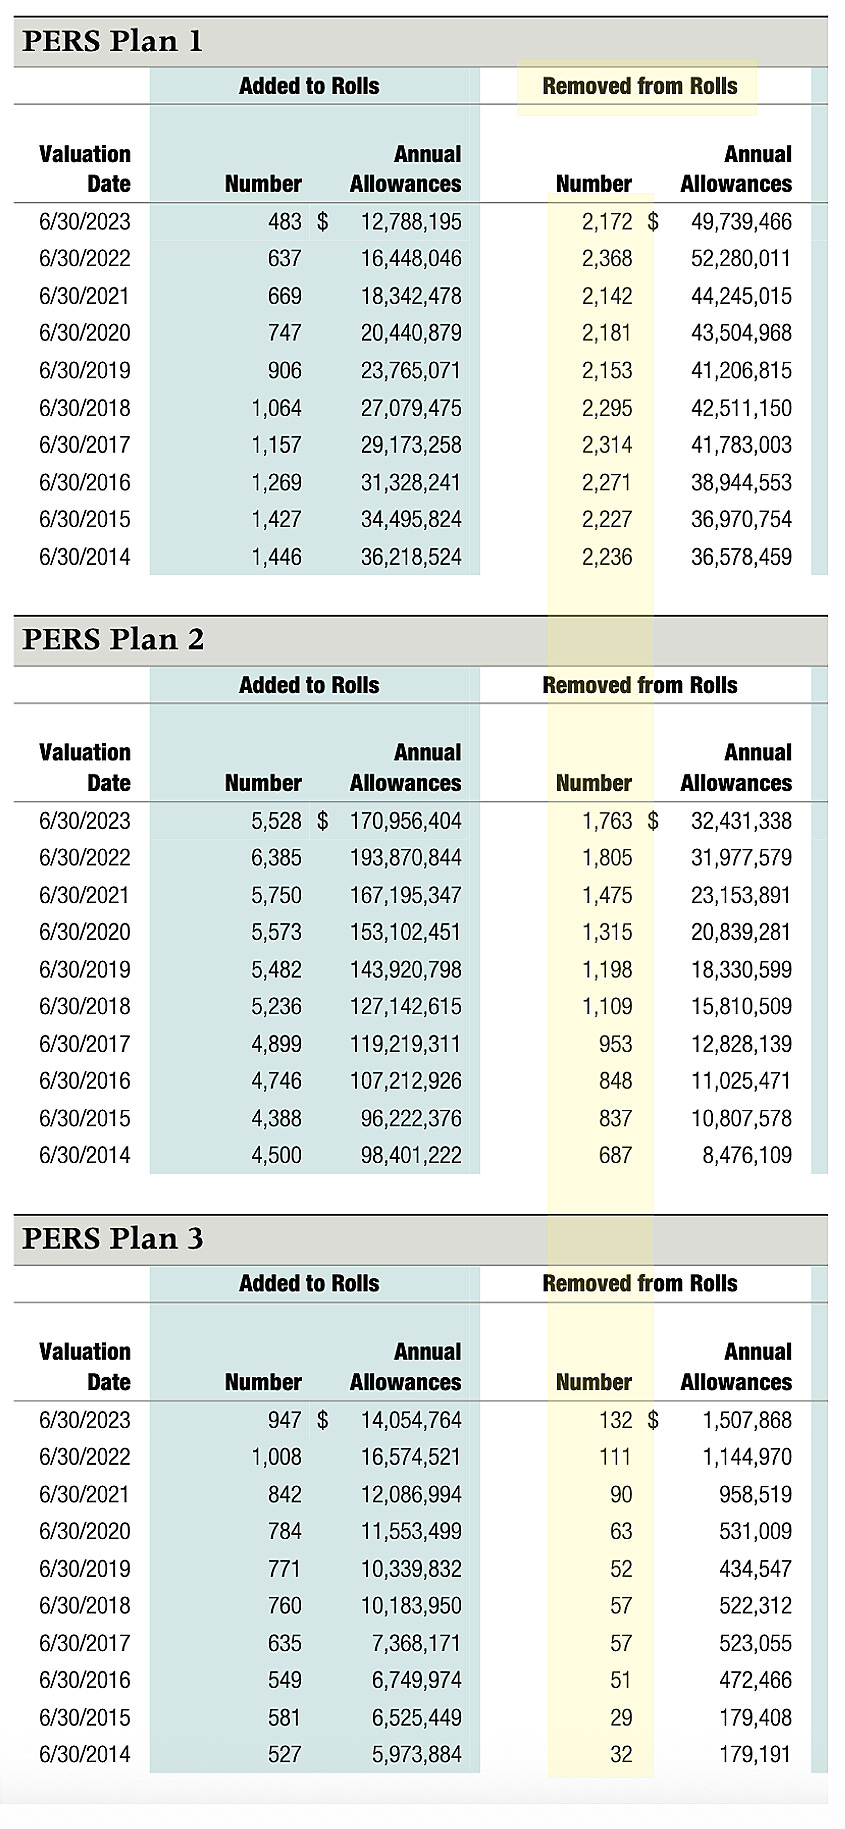
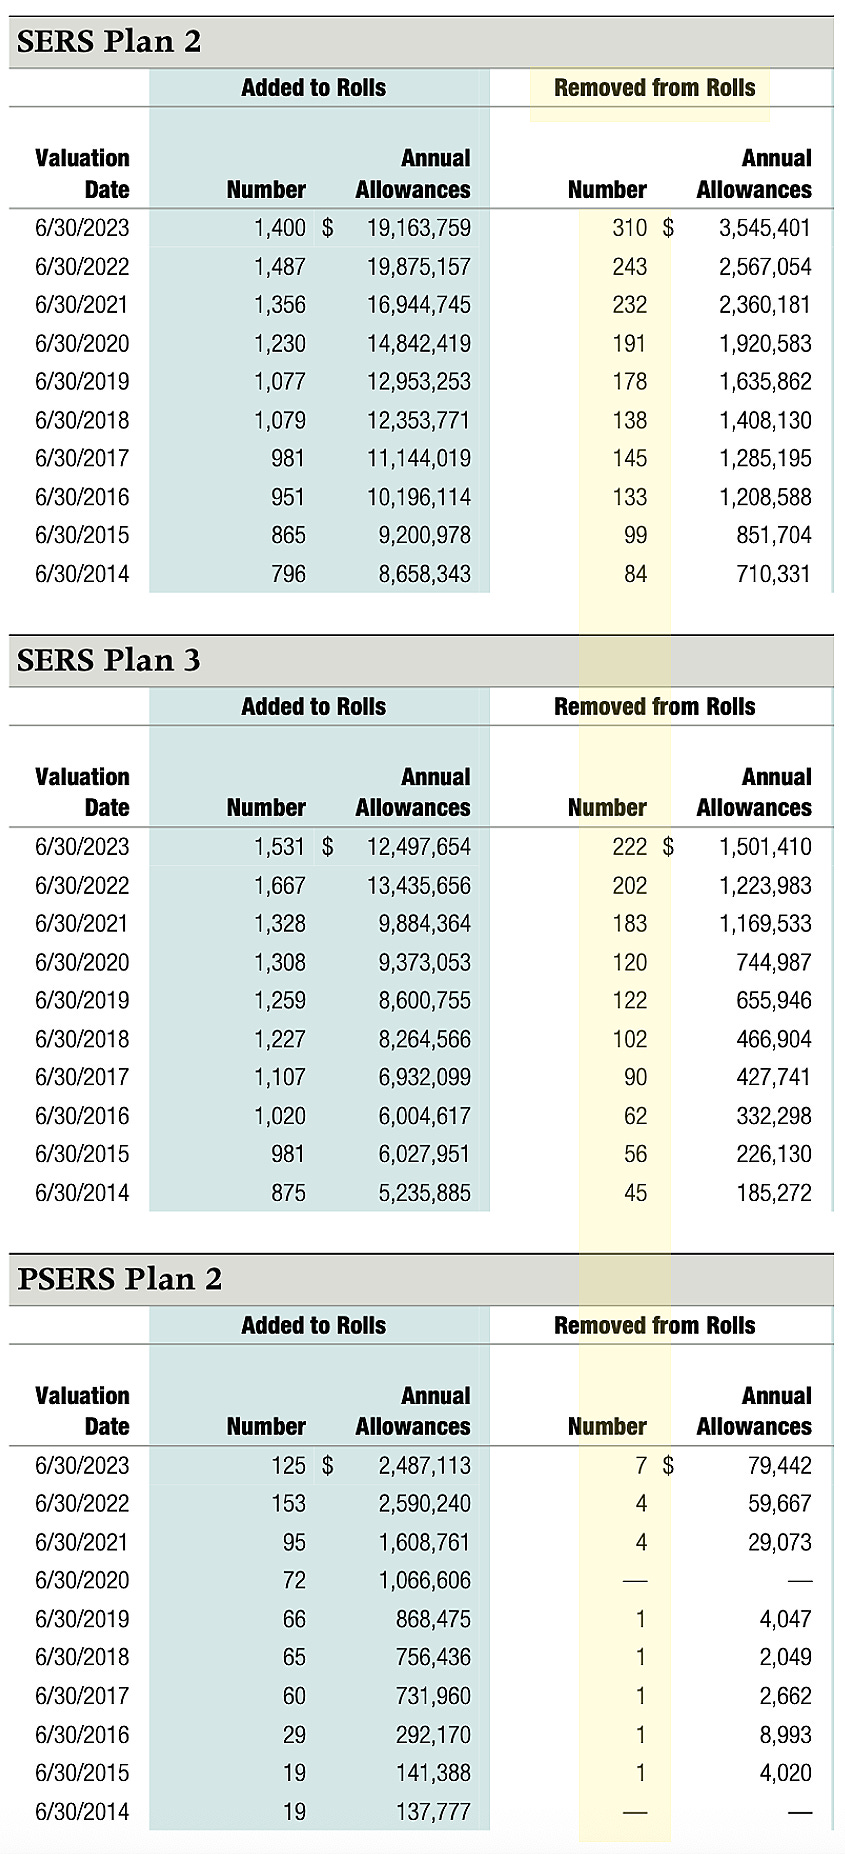
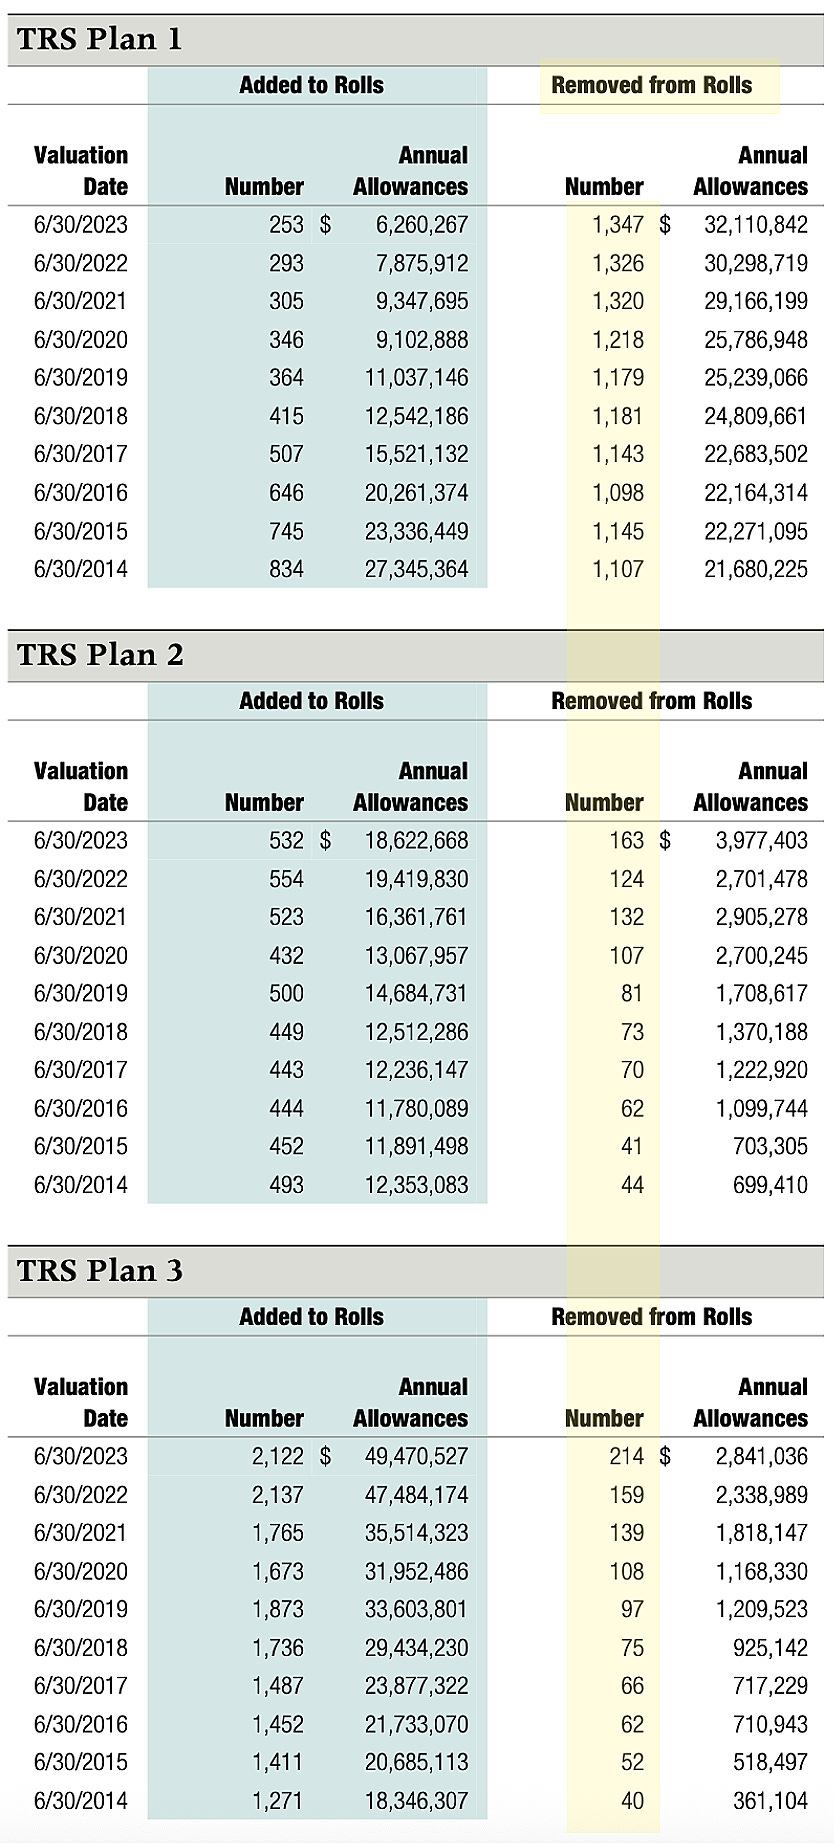
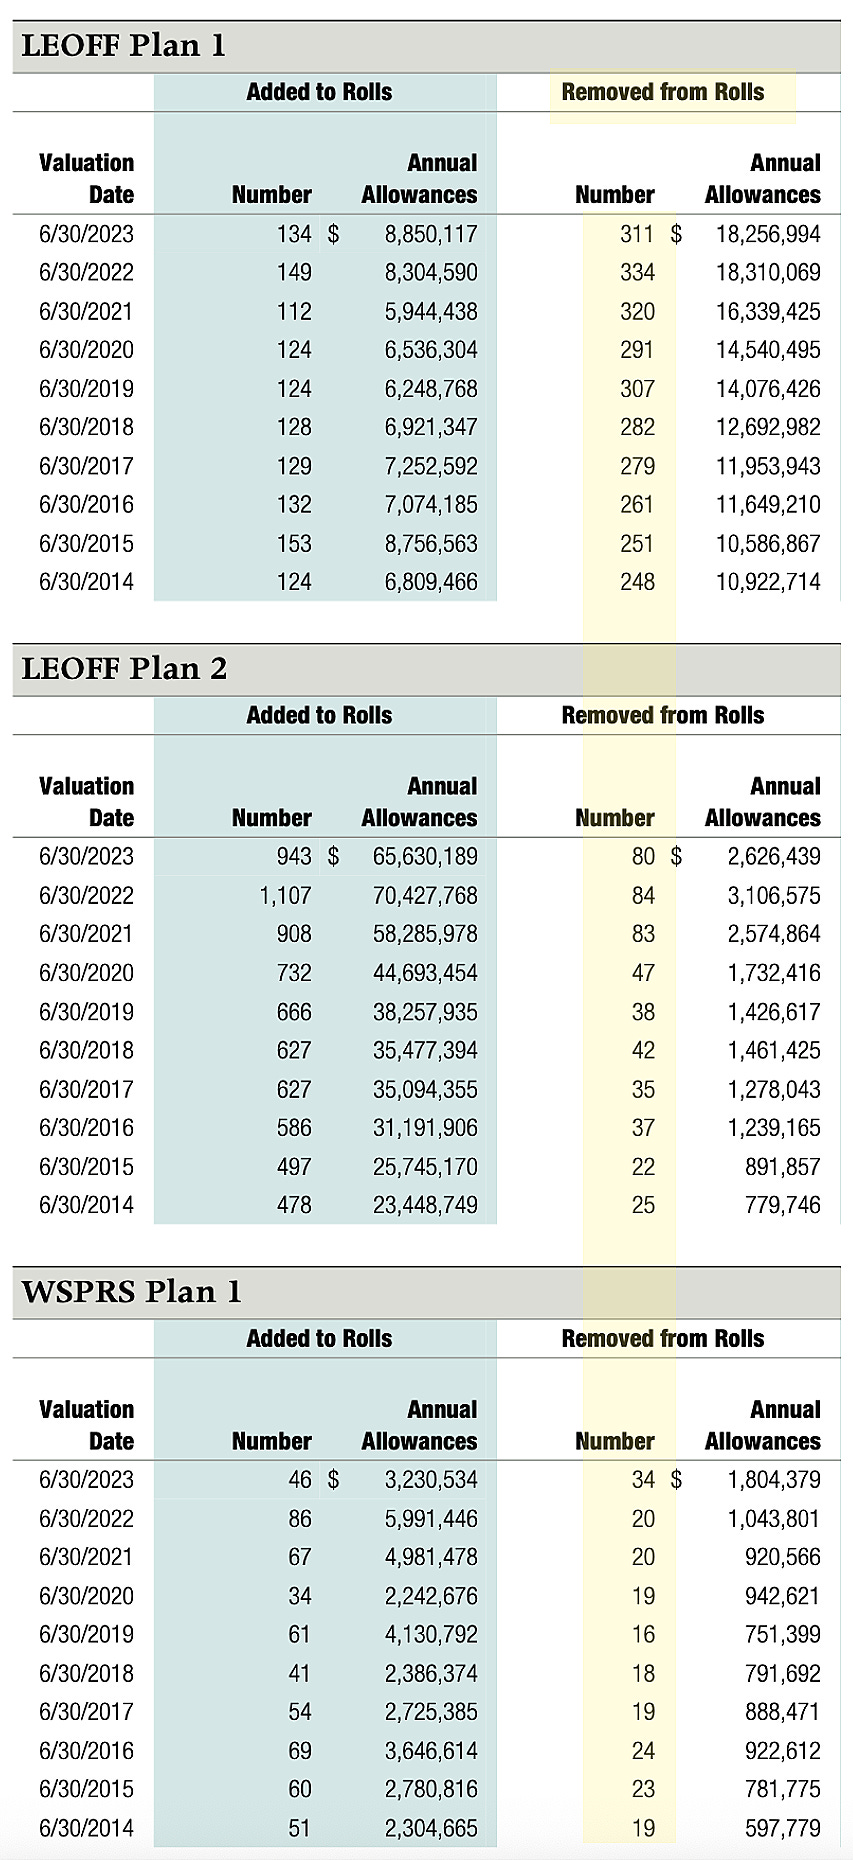
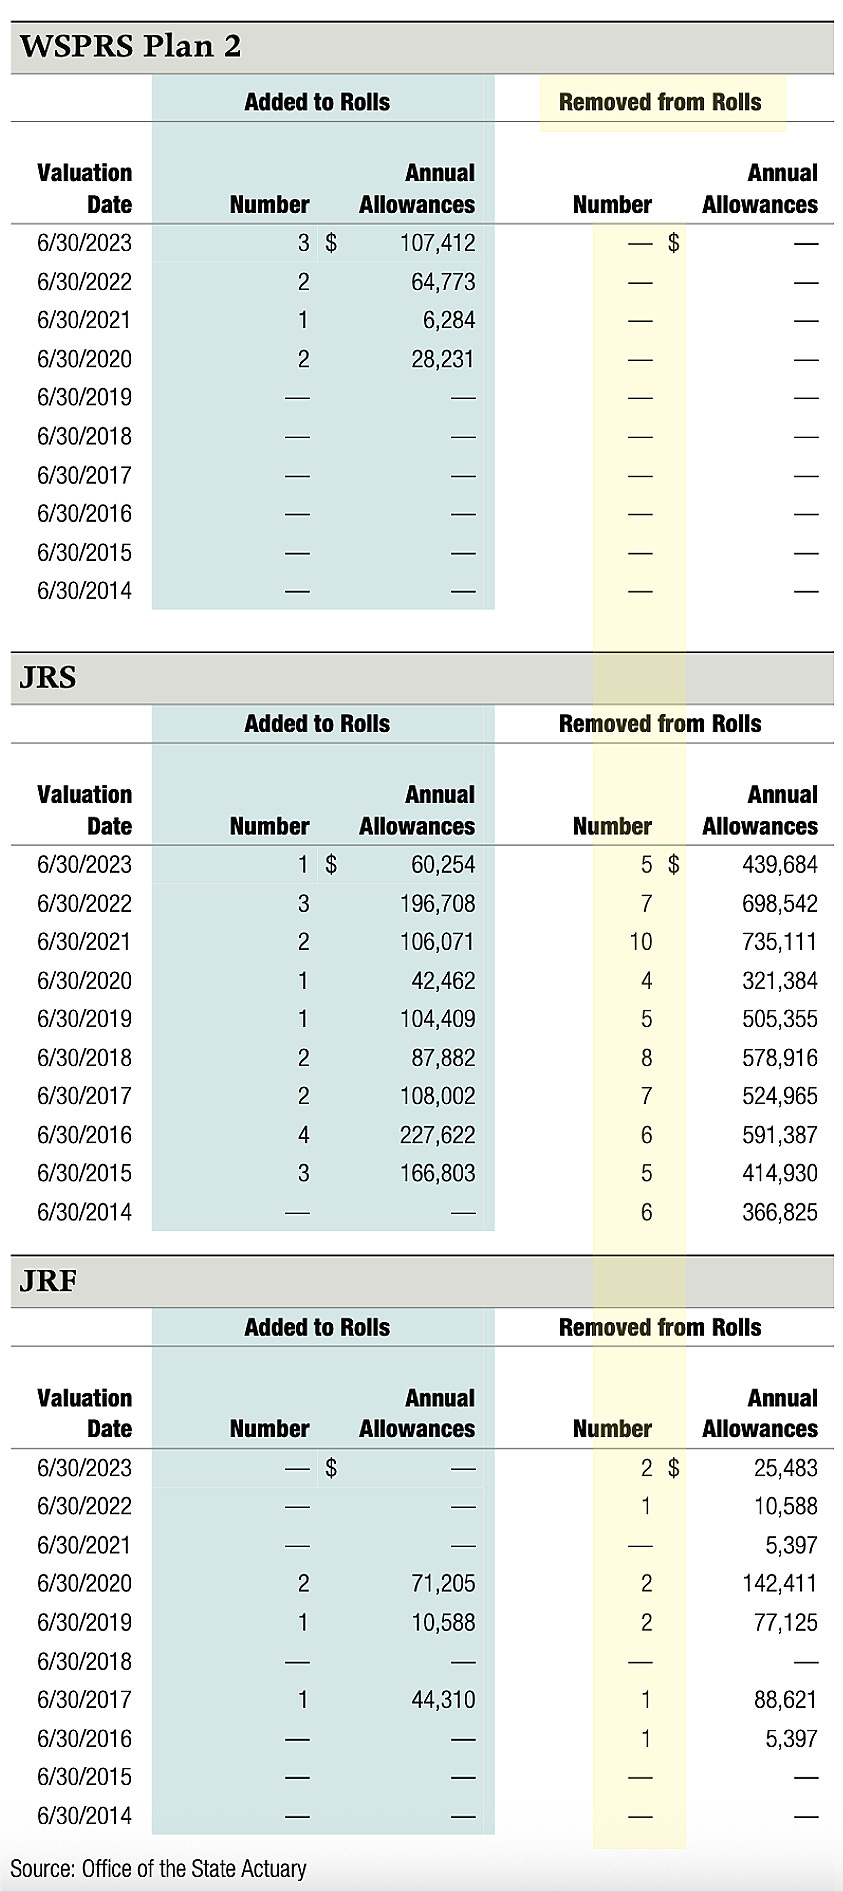
Annual Comprehensive Financial Report
Pension Trust Funds of the State of Washington
for the Fiscal Year Ended June 30, 2024
Prepared by: Washington State Department of Retirement Systems
.
pages 168 - 172 (Schedules of Retirees and Beneficiaries Added to and Removed from Rolls)
.
.
*in case you have forgotten …
Pandemic Milestones:
January 20, 2020
-First covid case in the U.S.
December 11, 2020
-Pfizer Emergency Use Authorization
December 18, 2020
-Moderna Emergency Use Authorization
August 23, 2021
-Pfizer full FDA approval
January 31, 2022
-Moderna full FDA approval
April 10, 2023
-Biden declares the end of the pandemic
.
.
.
It looks like Washington state mirrors the national ‘pandemic window’ in terms of the death rate climbing substantially once the vaccine was introduced.
It’s striking that the younger workers seem hardest hit -- presumably because they were forced to take the injections in order to keep their jobs. If there are national statistics that track retired vs. non-retired mortality, I’d guess they’d be similar to your state.
It’s a stark confirmation of your wise decision to retire rather than take the shot, if I remember your story rightly. You and the other retirees dodged a bullet.