
The Third Spike
State All Cause Mortality Data in the Context of the Covid Timeline

I’m a former public employee that did not want to put an experimental drug into my body just to keep my job. That experience has probably scarred me for life. I am now looking at public institutions, state by state, to see if there is any potential (official) evidence of harm caused by those coerced covid vaccinations.
.
Since it has occurred to me that it is really, really nice to have official monthly data in order to compare events to the timeline of Covid, I am going to keep giving you that from state to state as I find it … a continuation of what I started here.

When it comes to Debbie Lerman’s three spike pattern seen again and again in many datasets for mortality during the Covid era, spike numbers one and two are pretty easy to see and understand. There were no vaccines at all before December of 2020 … spike one (Moderna and Pfizer EUA). There were no fully approved vaccines until August of 2021 … spike two (Pfizer full FDA). But as I explored in my recent post “A Problem in the Timeline”, the third spike made little sense if it was tied to the full approval of Moderna’s vaccine. The third spike almost always manifests as a much, much larger bar on my graphs in January of 2022. But the Moderna full approval happened on the very last day of January 2022.
My reexamination of the official CDC timeline of Covid gave me new insight on what other factors may have caused the third spike - namely, the recommendations for when to get booster doses. In December of 2021 and January of 2022 our health authorities released several advisories regarding the timing of booster shots. The consistent message was that you should get boosted 5 months after your primary series.
If we can assume that there was a significant portion of the populace that waited for the full approval of the Pfizer shot in August of 2021, then these good people following the new booster advice, would have gotten their shots 5 months later … around January of 2022.
.
For me that is the true explanation of the 3rd spike.

.
.
.
COVID-19 vaccine boosters administered per 100 people
.
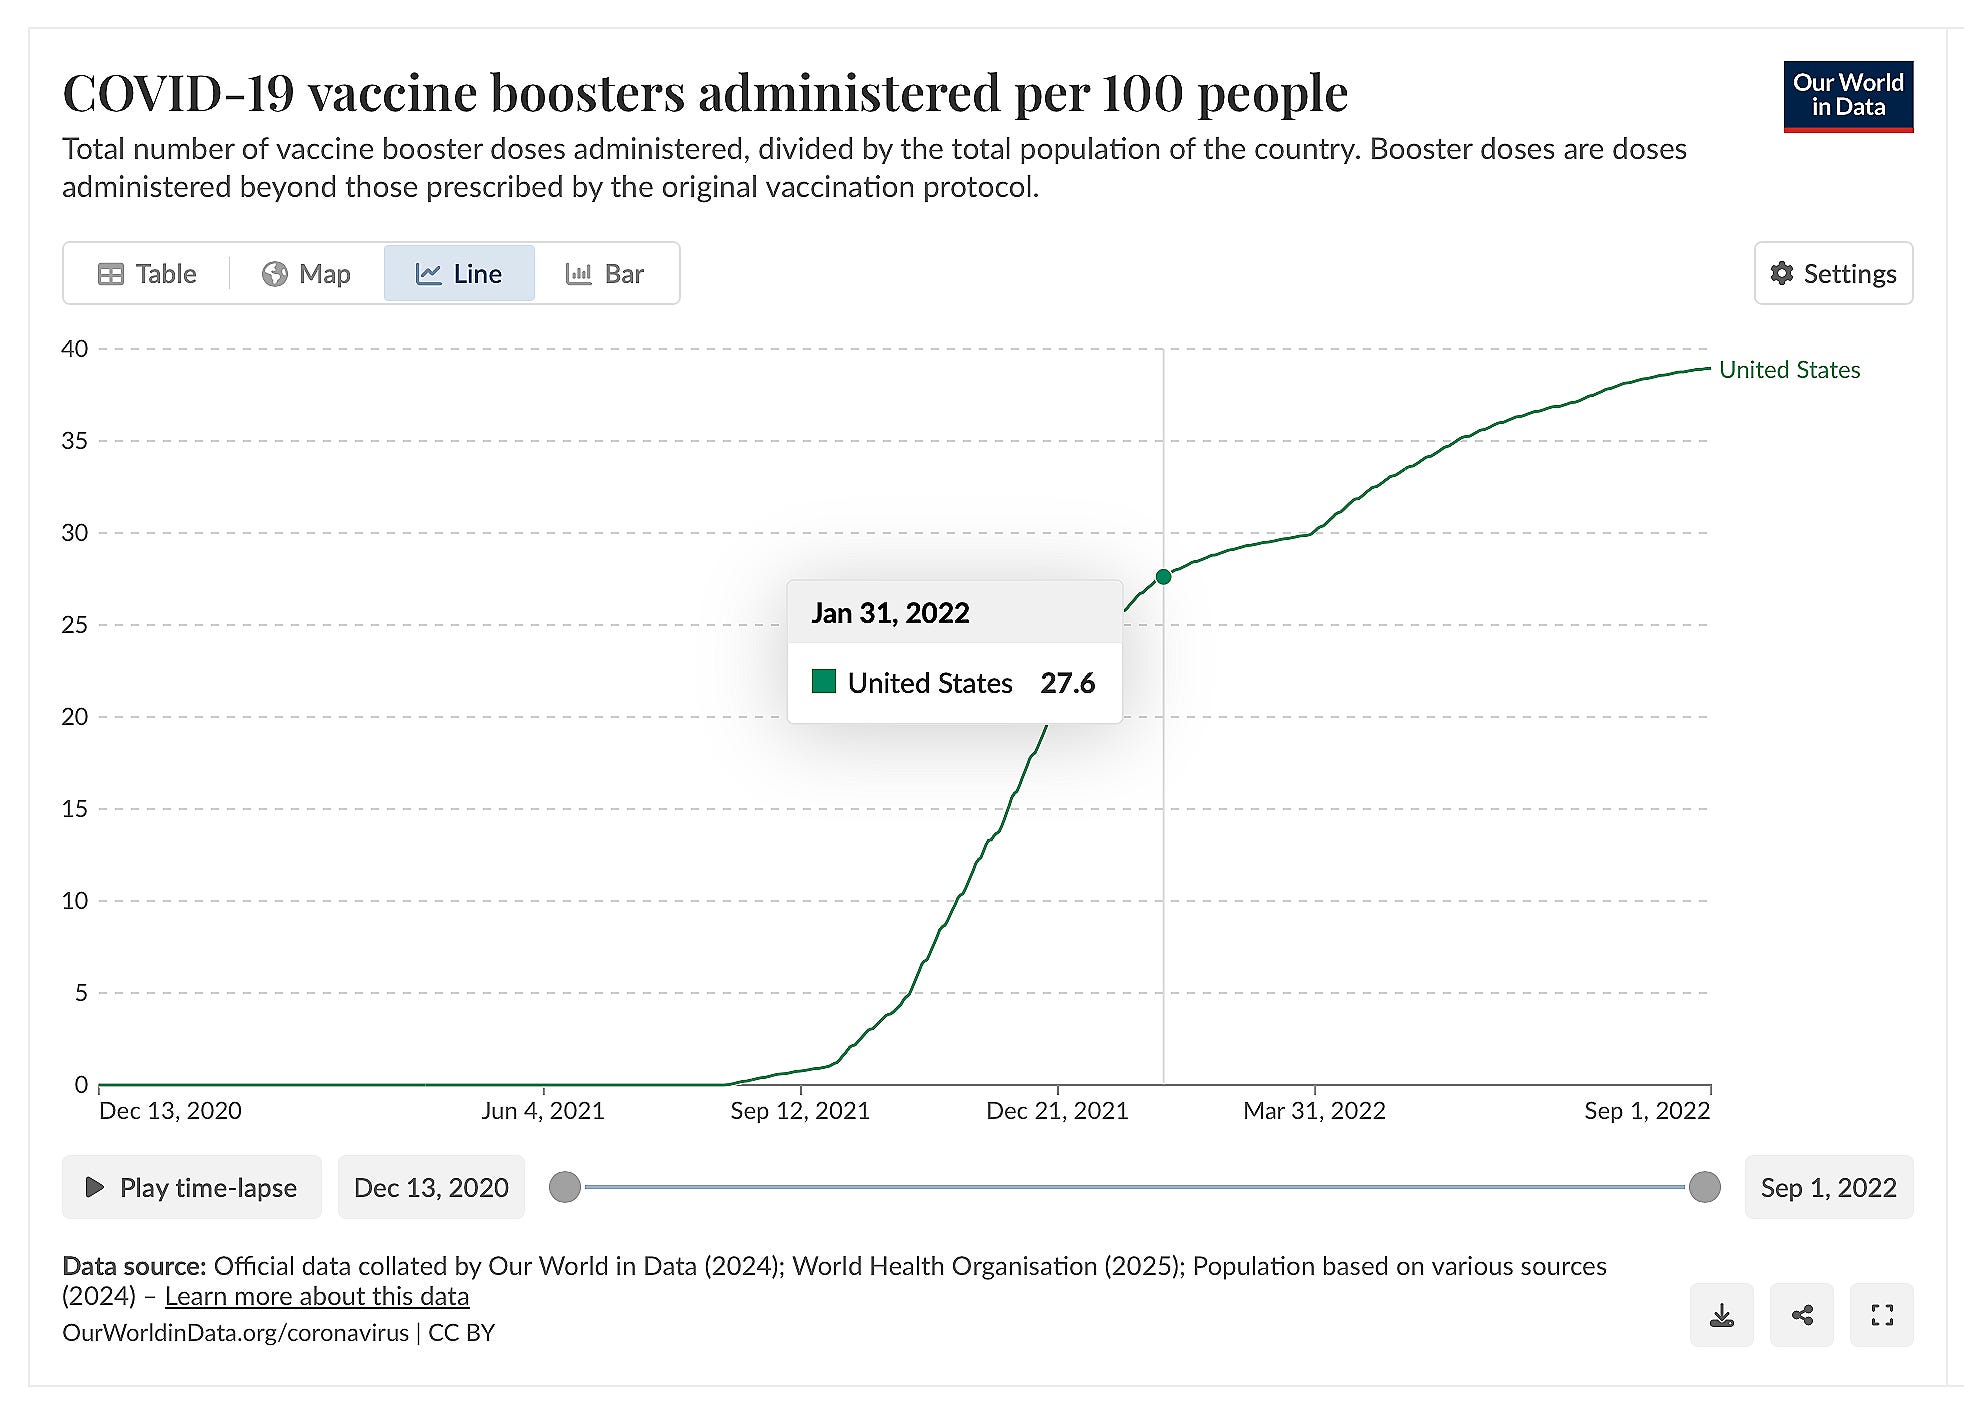
*the steepest rise in the uptake of boosters on the above chart from Our World in Data is clearly seen in the months of December 2021 and January 2022.
.
.
.
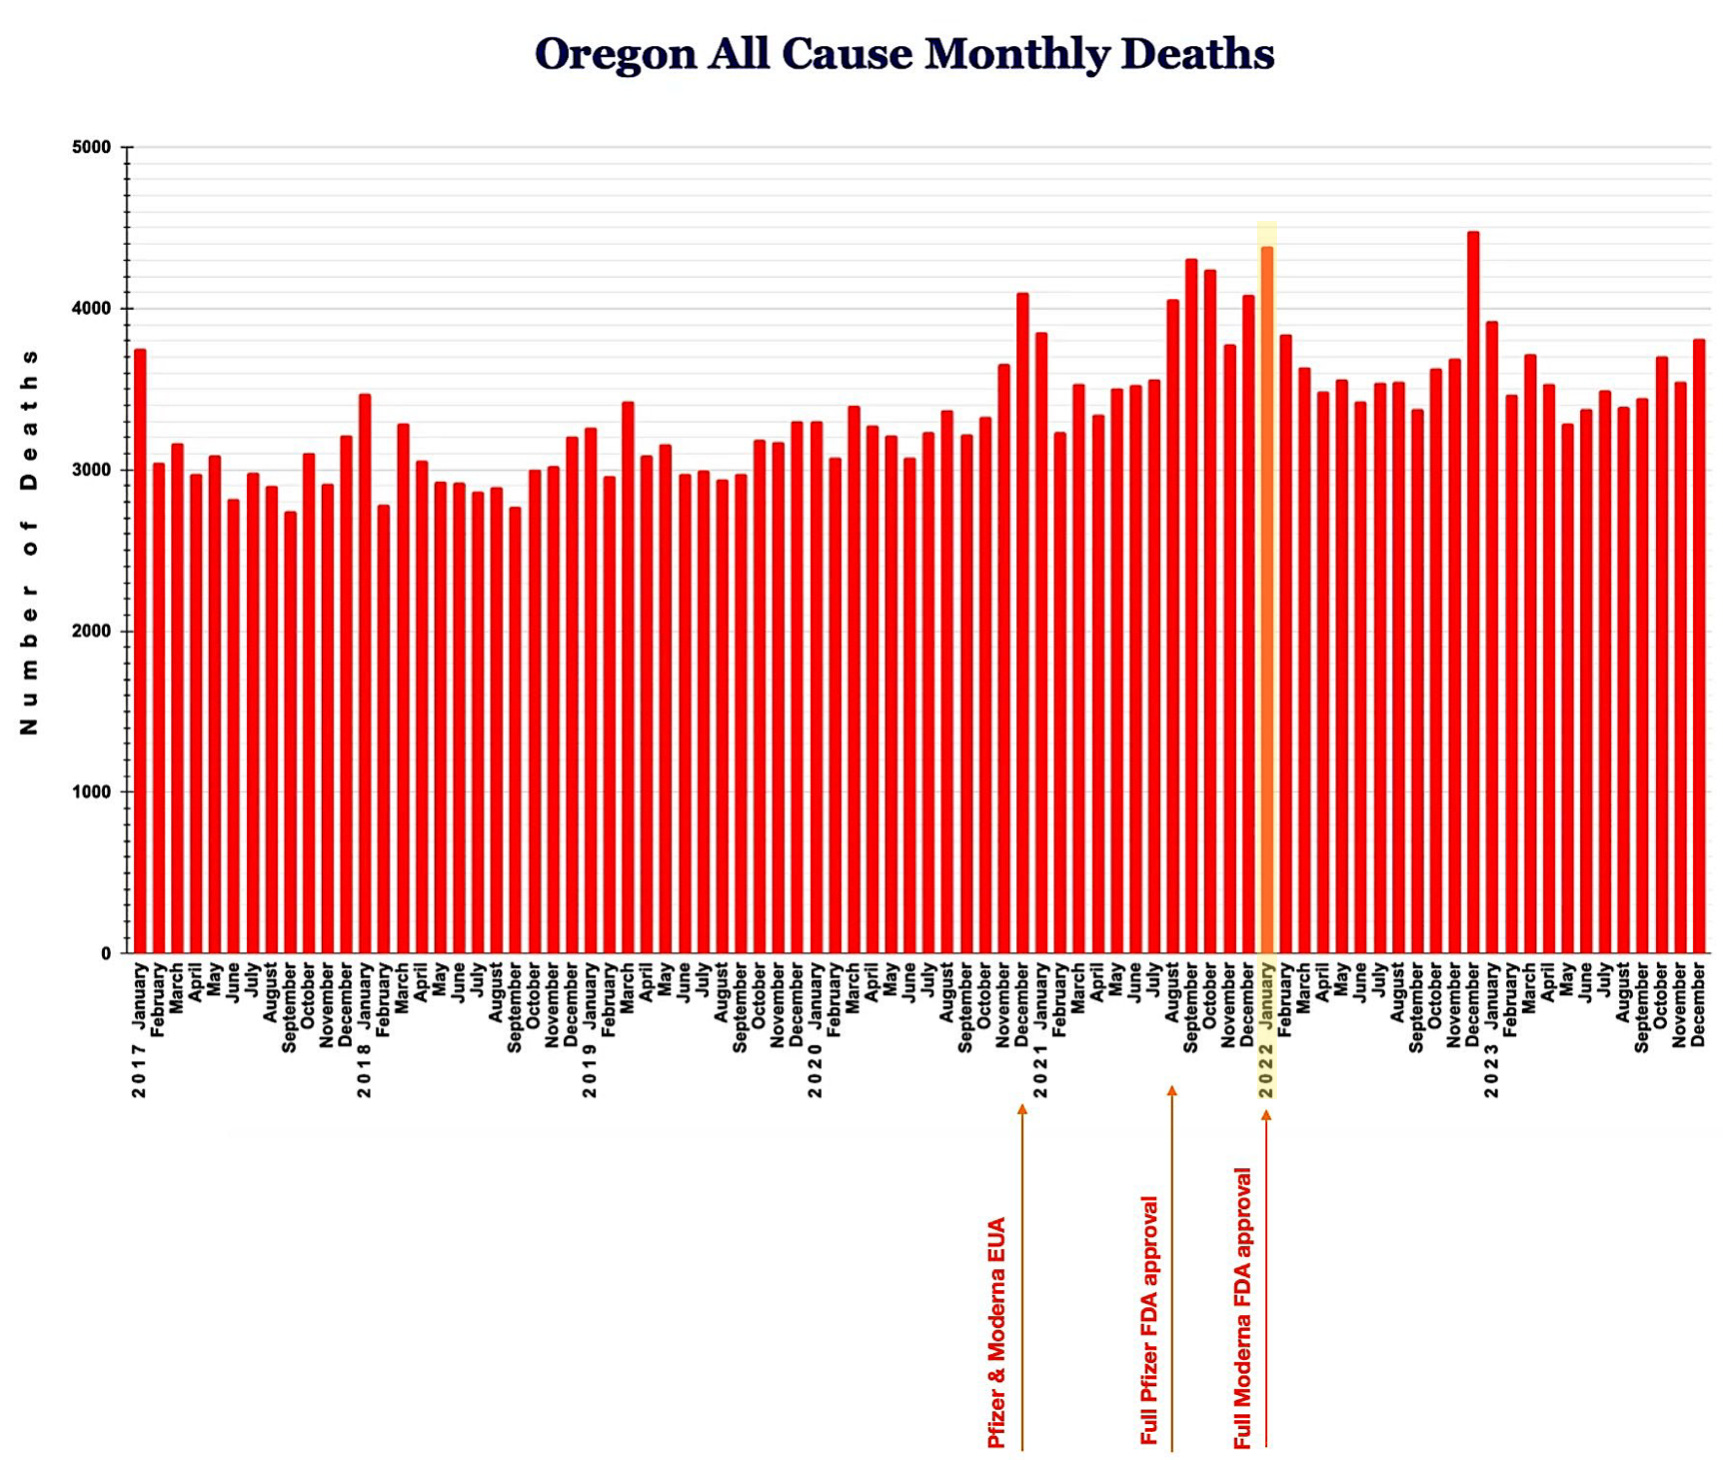
*please compare this Oregon all cause mortality graph I made previously with the Oregon Covid vaccine uptake chart that follows. I think you will see the correlation between the third spike of mortality in January of 2022 with the booster uptake that happened in the same period.
.
T2. Statewide Data Over Time - Total Population
.
*here where I live in Oregon there is a very useful database provided by the Oregon Health Authority that gives the numbers for vaccine uptake. Using that dashboard, I was able to make this graph showing the timing of each dose:
.
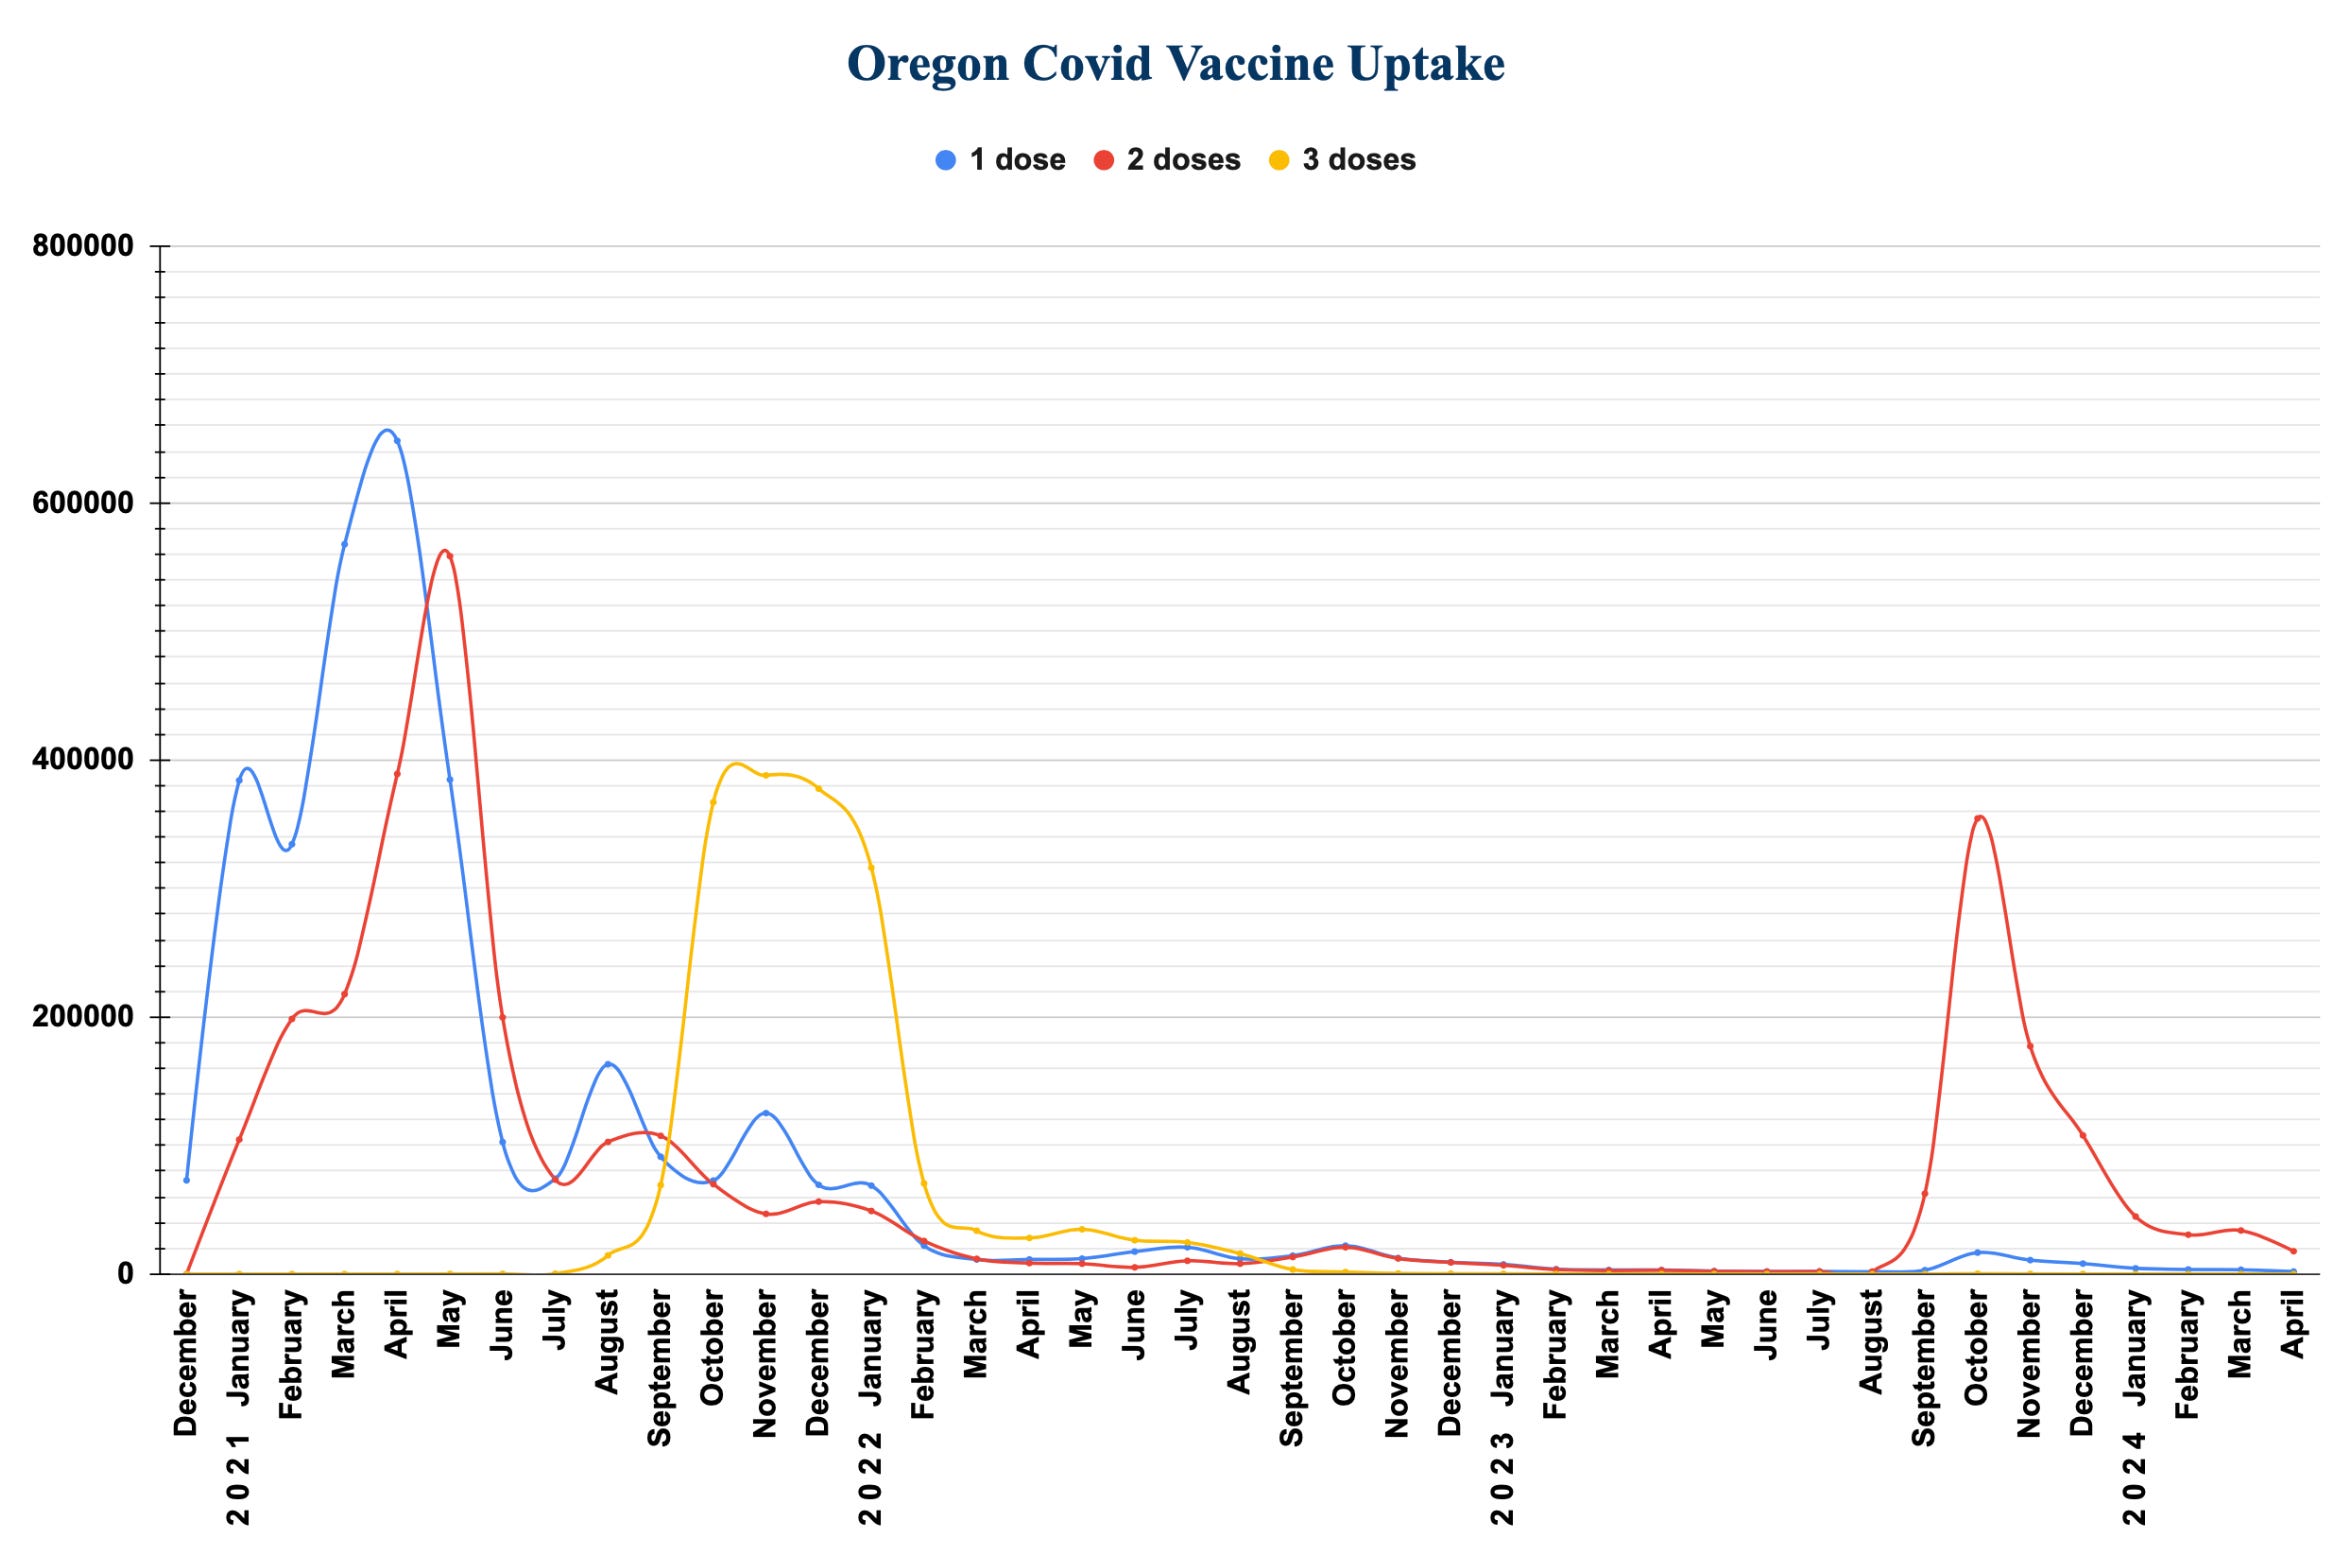
*clearly, the third dose was well underway in December of 2021 and January of 2022.
.
.
.
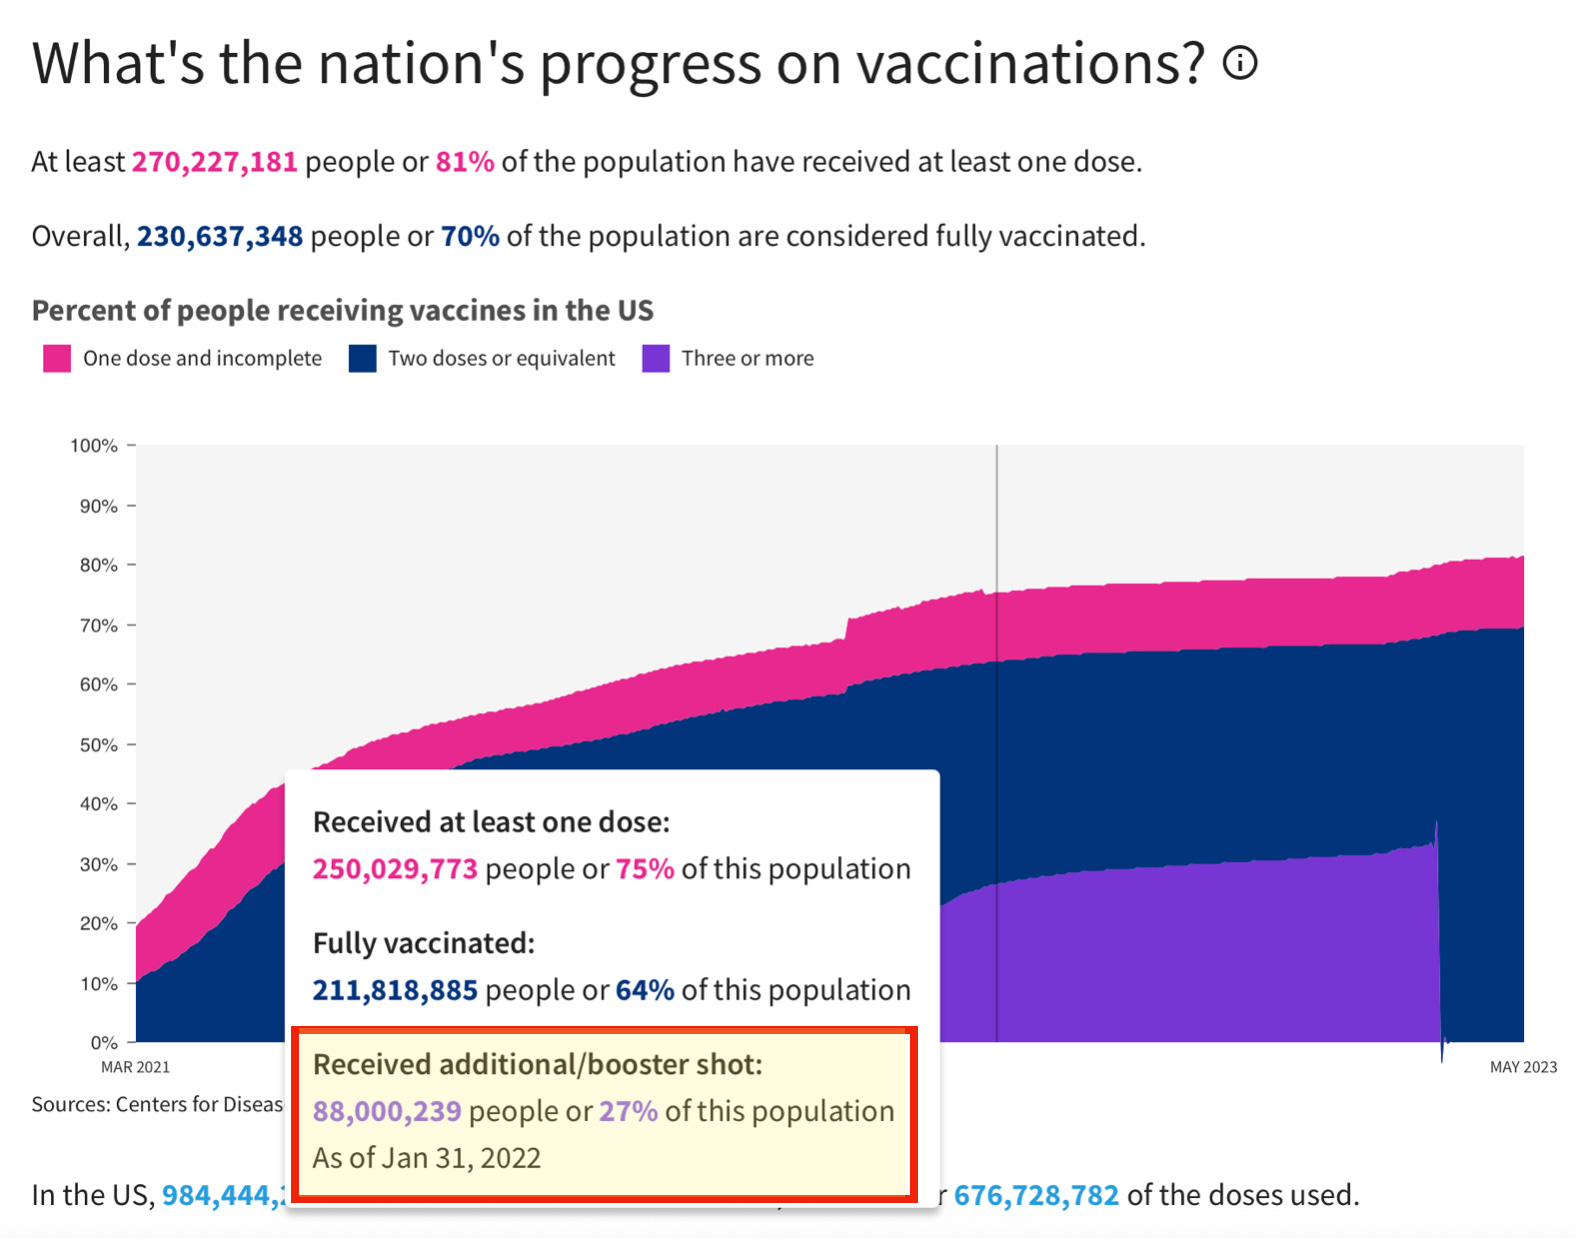
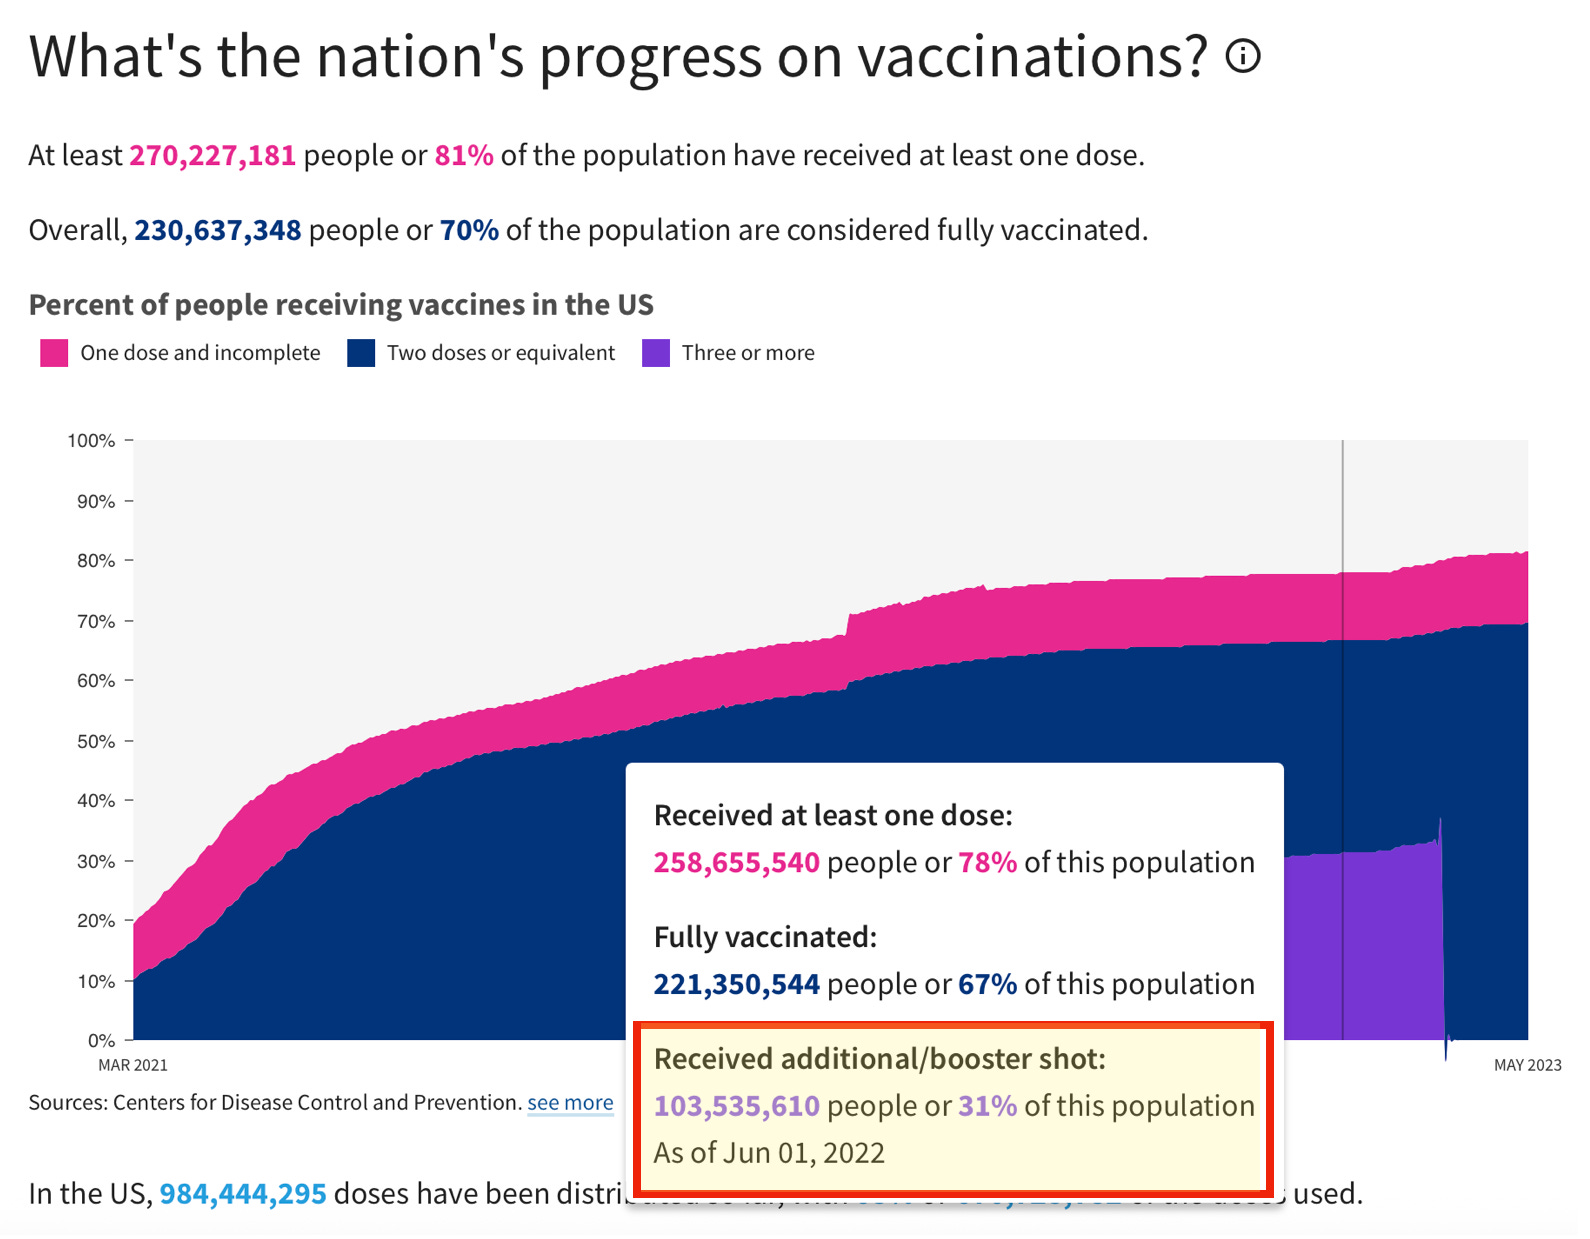
US Coronavirus vaccine tracker
.
*I show the next three images from USA Facts to call your attention to the progression of uptake percentages for the boosters. At the beginning of December 2021 the uptake was 13%. At the end of January 2022 that had more than doubled, ending at 27%. The uptake tapered off for the next months in 2022, by June it had only reached 31%. Clearly, this shows the steepest rise around December 2021/January 2022.
.
.
.
.
.
*in case you have forgotten …
Pandemic Milestones:
January 20, 2020
-First covid case in the U.S.
December 11, 2020
-Pfizer Emergency Use Authorization
December 18, 2020
-Moderna Emergency Use Authorization
August 23, 2021
-Pfizer full FDA approval
January 31, 2022
-Moderna full FDA approval
April 10, 2023
-Biden declares the end of the pandemic
.
.
.
This is really really great - thank you for clarifying the third spike in terms of boosters (vs Moderna EUA)!!!!
Thanks for the restack!