
Your Money ... And Your Life
Cui Bono?


There may be some of you that have been looking at my posts for a little while now hoping I will finally give up the ghost on all this pension stuff. Honestly, I am probably there with you … it’s boring as hell and usually very depressing. I console myself with the conviction that a historical record must be preserved, and I slog on.
But isn’t it really just about my own personal axe to grind, me being a former public employee and pissed off about what happened to me?
Yes, 100%.
.
But I also think this little tide pool of numbers speaks to a larger current …
.
.
.
“…For most states, unfunded pension liabilities are the largest of three major long-term obligations weighing on their future finances, ahead of unfunded retiree health care benefits for public employees and outstanding debt. Although still sizable, the gap between what states collectively have set aside and what they owe in public pension benefits narrowed after financial markets surged in fiscal year 2021, according to Pew projections.
States owed a total of $1.25 trillion in unfunded pension benefits in fiscal 2019, the final year before the pandemic. Despite a quick but deep economic downturn triggered by COVID-19, Pew projections in September 2021 indicated that pension debt had decreased below $1 trillion by the end of fiscal 2021, and state pension plans reached the highest-funded level since the Great Recession.
The improvement was mostly due to a boost in pension plan savings, the highest gains in 30 years on pension funds’ stock market investments, and from substantial increases over the past decade in state employer and employee contributions to pension funds.”
.
“The improvement was mostly due to a boost in pension plan savings …”
.
Where did all these “savings” come from?
.
.
.
From time to time in my old posts about these state and local pension systems I would reproduce tables for actuarial gains and losses. These showed what these folks speculated would happen in a given fiscal year versus what actually occurred. They would then put a number on that gain or loss. It was my report for the Michigan retirement system that had my most in-depth look at this subset of statistics:
“… Back to those actuarial gains and losses. I have stated in the past that I liken those sort of tables to a bookie’s diary. The actuaries are saying, “hey we really thought this was going to happen, and it didn’t … it really turned out like this …” Have you ever been watching a sports game on TV and there might be an ad for Fanduel, or maybe even a commentator mentions the “over under” bets? Well, it seems that these tables of gains and losses are essentially the same. But these actuaries are the professional’s professional when it comes to serious speculation. It’s their job to get it right as close as possible. Pay close attention to the language in the descriptions for the areas I have highlighted in those tables. In each category that I have highlighted with yellow, a gain would indicate higher mortality. As you will see by looking at the numbers and my graphs, the pro betters here were always off big for mortality during the pandemic. Millions of dollars off, big. They just kept being surprised by what actually happened. But that’s okay, those millions went back into the coffers. That’s why it is a gain, after all.”
.
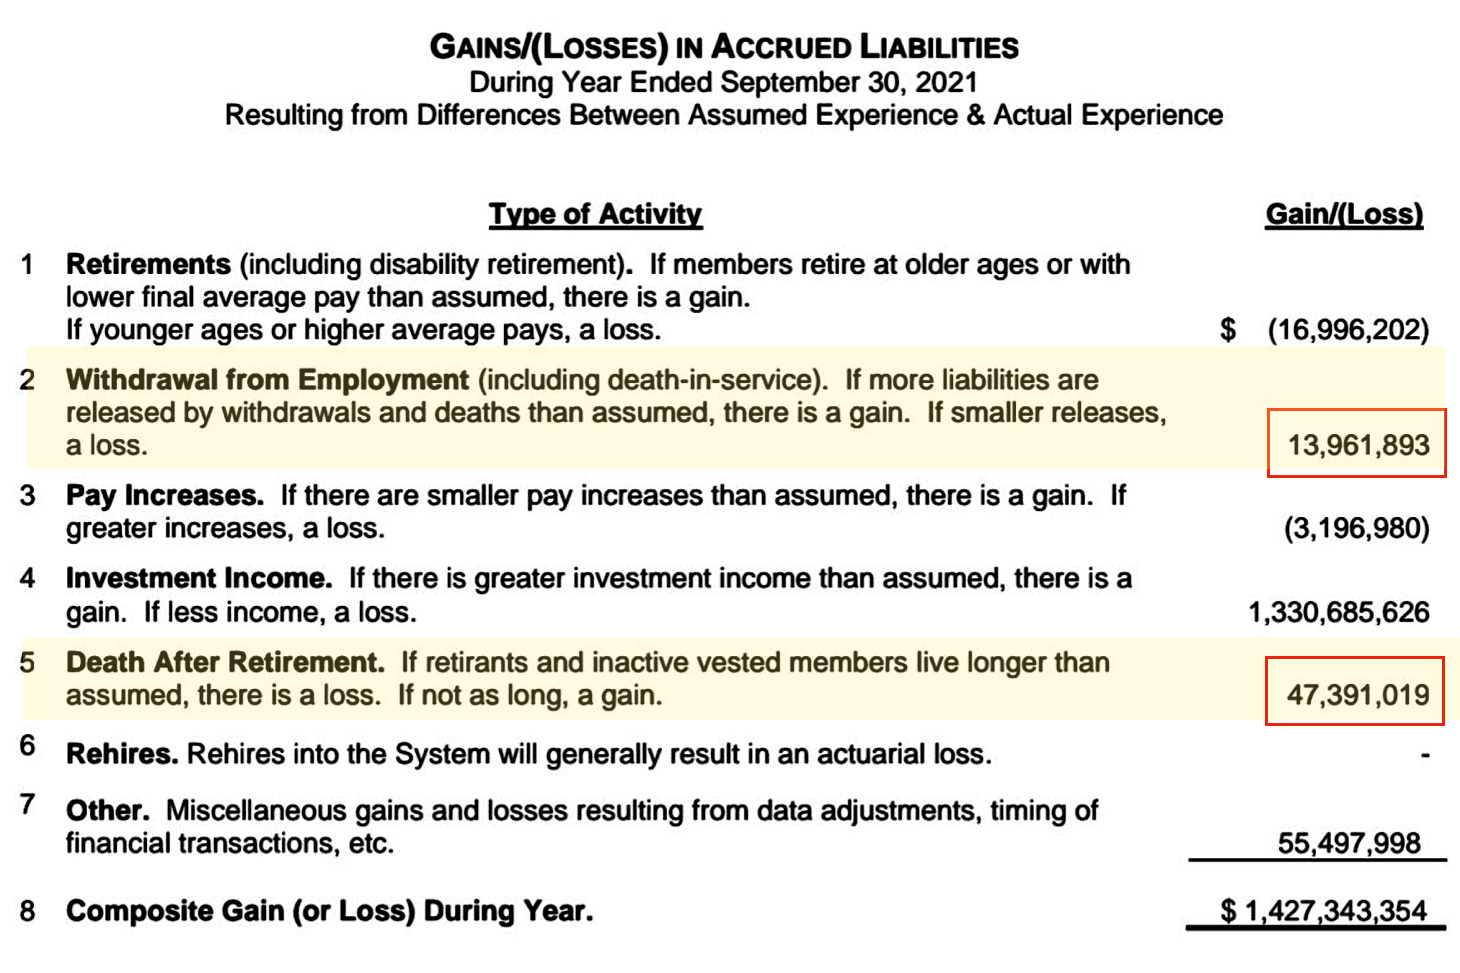
I will now call your attention back to the 2021 gain/loss table from Michigan:
.
As a reminder, gains on this table have no parentheses around them, but losses do. I originally highlighted “Withdrawal from Employment” because it includes “death in service” numbers in the gain/loss figure. That would translate to employees that died while still working. As you can see by the explanatory sentence for that … “If more liabilities are released by withdrawals and deaths than assumed, there is a gain”.
That figure is troubling for sure, but the real reason I wanted to go back to this one is the “Death After Retirement” line. The explanatory sentences … “If retirants and inactive vested members live longer than assumed, there is a loss. If not as long, a gain”.
As you can see for yourself, 47 million dollars went back into the coffers in 2021 for retirants that did not live as long as they were supposed to.
.
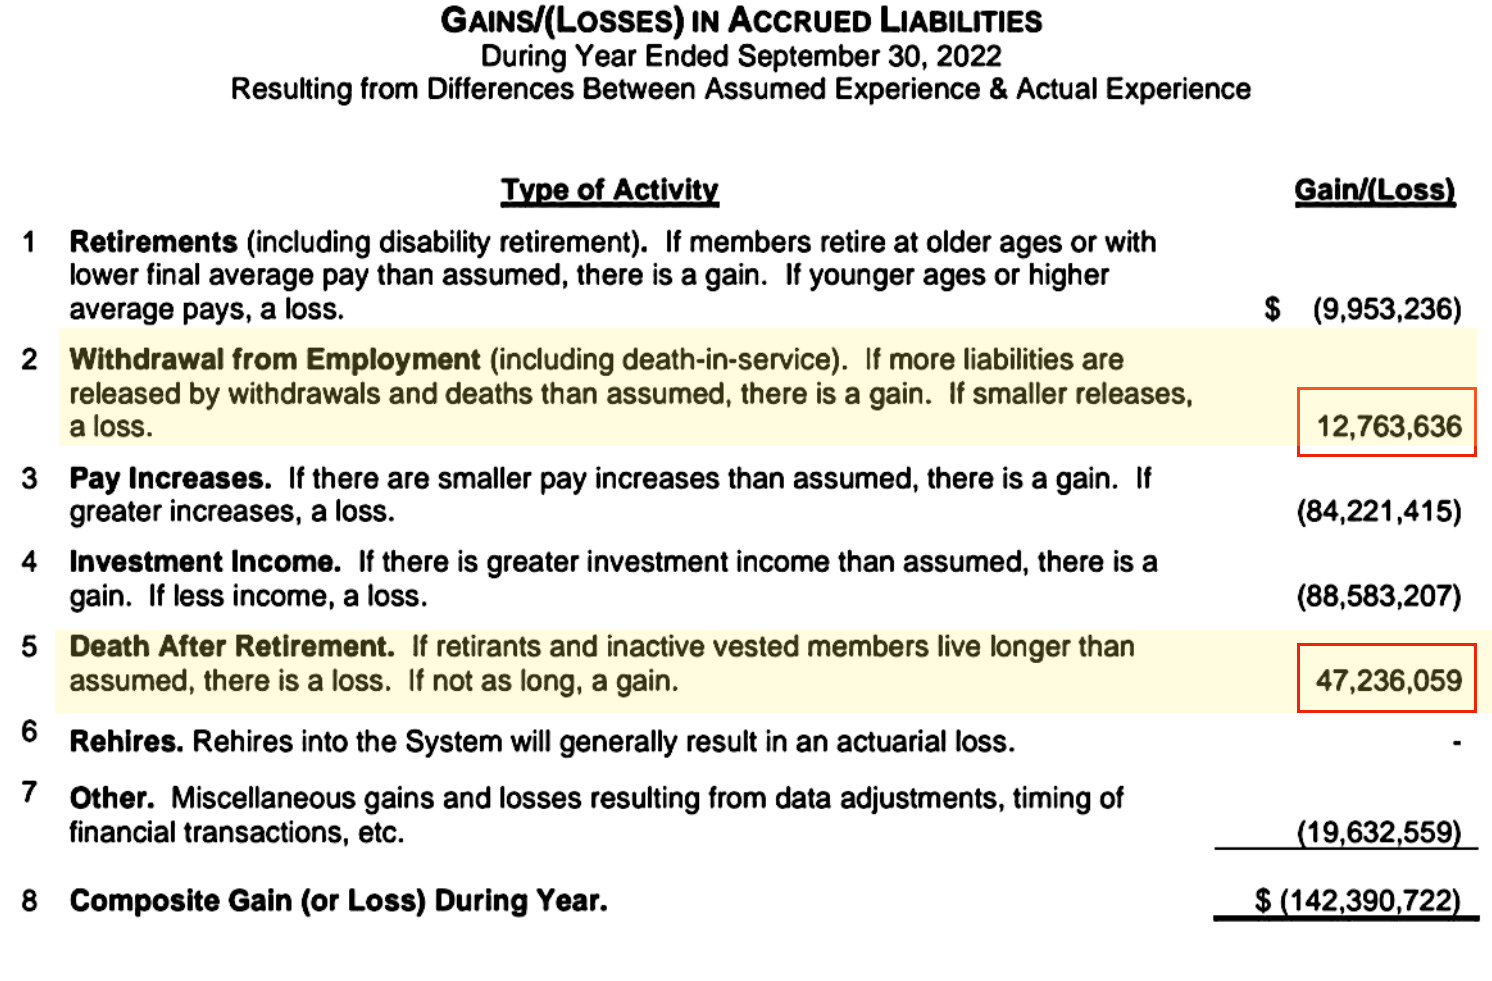
And (almost) the same exact thing happened in 2022:
.
Another 12 to 13 million back in the bank for “Withdrawal from Employment” and one more 47 million dollar infusion of funds for “Death After Retirement”.
But one big difference between the two tables is actually something I completely missed the first time. Notice the numbers for “Investment Income”. 2021 had a huge windfall, just as the Pew report claims. That is a 1.3 billion dollar gain! But then 2022 saw a modest piece of that go back with an 88 million dollar loss.
***(I originally got the math wrong and stated that this 88 million was two thirds of the 1.3 billion … nope, not even close! -updated 11/22/25)
.
This is just one state’s numbers for just where all those “savings” may have come from as mentioned in the Pew report. If Michigan looks to have gotten gains equalling around $50 million for the mortality of its members in FY2021, could we then extrapolate a more conservative $25 million to all fifty US states?
If so, that would be $1,250,000,000, or …
1.25 billion dollars.
.
Is it unreasonable to call this to everyone’s attention and suggest that this is a major component of the unprecedented economic turnaround that a these pension systems pulled off between 2019 and 2021?
.
.
.
Well here is another article from our friends at Pew:
“… The nation’s state retirement systems finished the 2021 fiscal year in their best condition since the Great Recession of 2007-09. According to projections by The Pew Charitable Trusts, the gap between the cost of pension benefits that states have promised their workers and what they have set aside to pay for them dropped in 2021 to its lowest level in more than a decade. Pew estimates that state retirement systems are now over 80% funded for the first time since 2008.”
.
Nope, not a word about the actuarial gains from pensioner’s mortality. It was the stock market, Baby!
.
“… Such progress would be significant in any year, but the improvement in fiscal 2021 occurred during a recession in which many analysts predicted that revenue losses related to the COVID-19 pandemic would increase retirement fund shortfalls. Instead, Pew found an increase in assets of over half a trillion dollars in state retirement plans, fueled by market investment returns of more than 25 percent in fiscal 2021 (the highest annual returns for public funds in over 30 years) …”
.
.
.
.
“… Unfunded state pension liabilities total $4.9 trillion or $15,080 for every man, woman and child in the United States. State governments are often obligated, by contract and state constitutional law, to make these pension payments regardless of economic conditions. As these pension payments continue to grow, revenue that would have gone to essential services like public safety and education, or tax relief, goes to paying off these liabilities instead.”
.
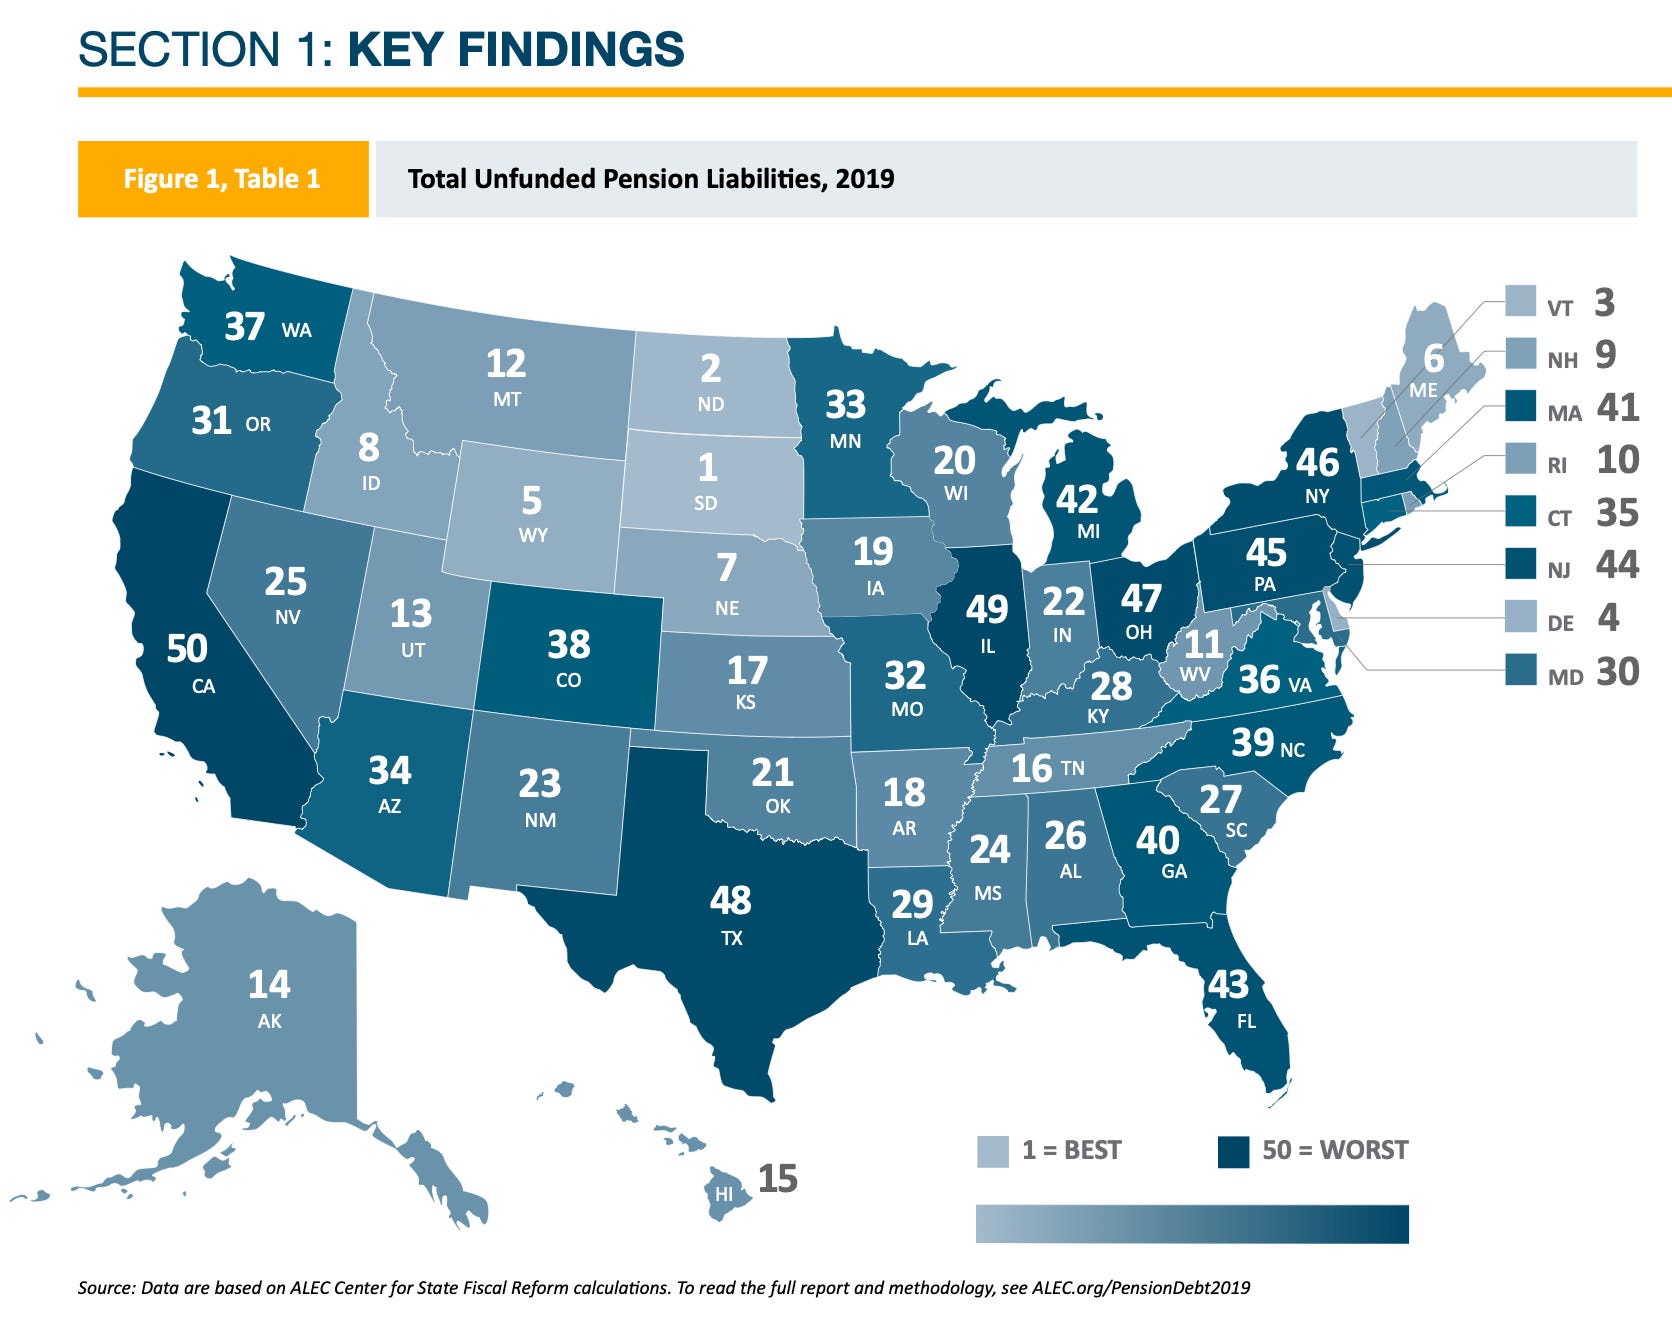
page 3 (Total Unfunded Pension Liabilities, 2019)
.
Notice the color scale for Best to Worst at the bottom right. This is a map of how the states rank for Unfunded Pension Liabilities in 2019. The darker the color on the map, the worst shape you are in. (Our friends in Michigan were in the bottom ten).
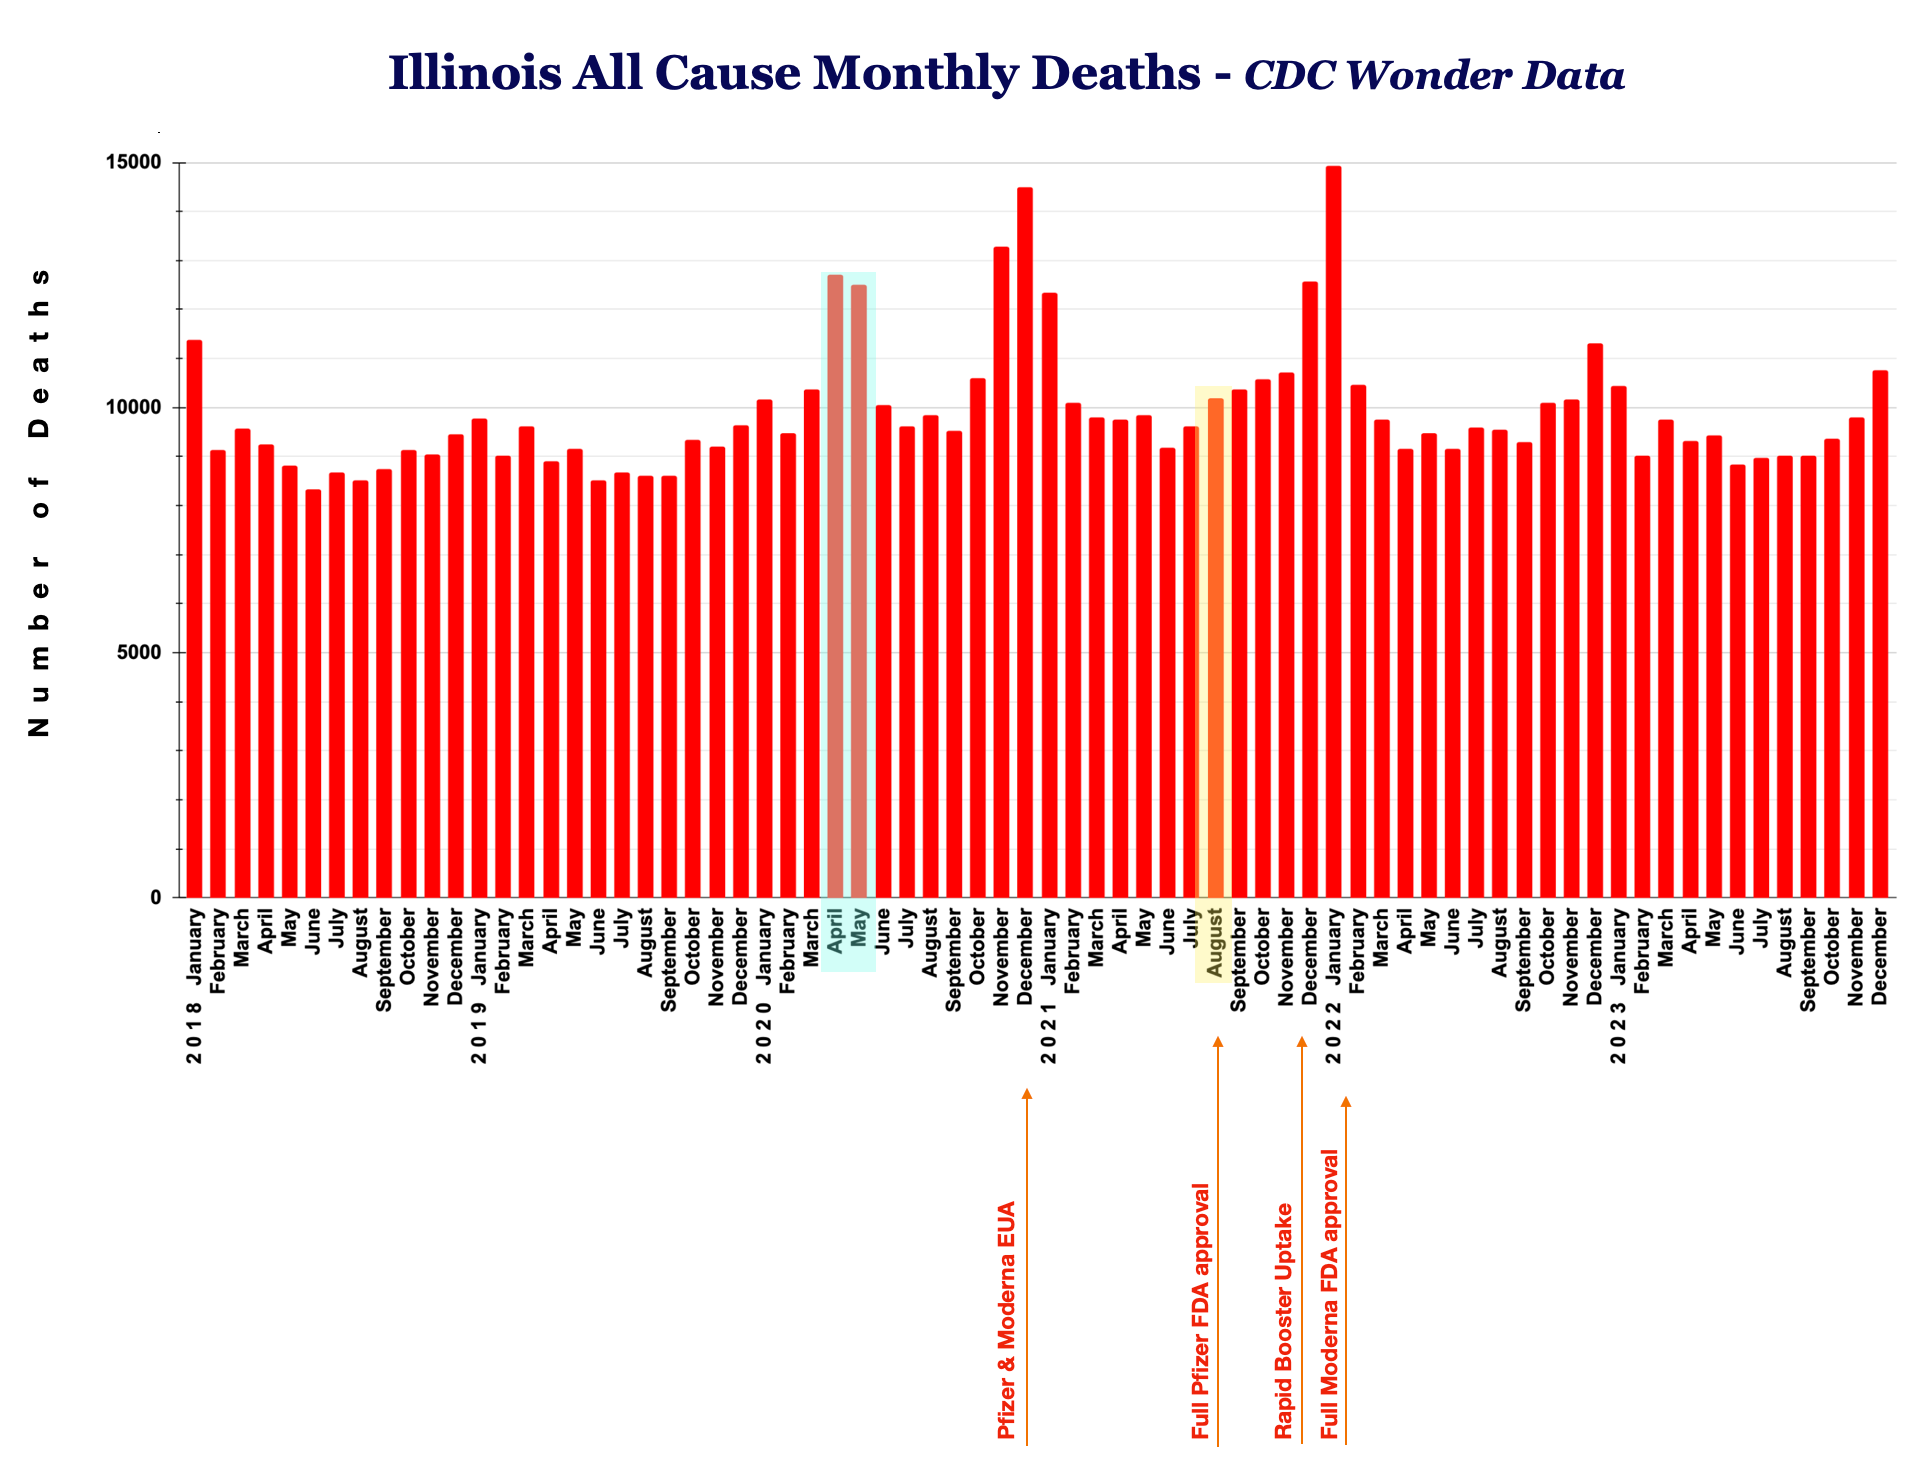
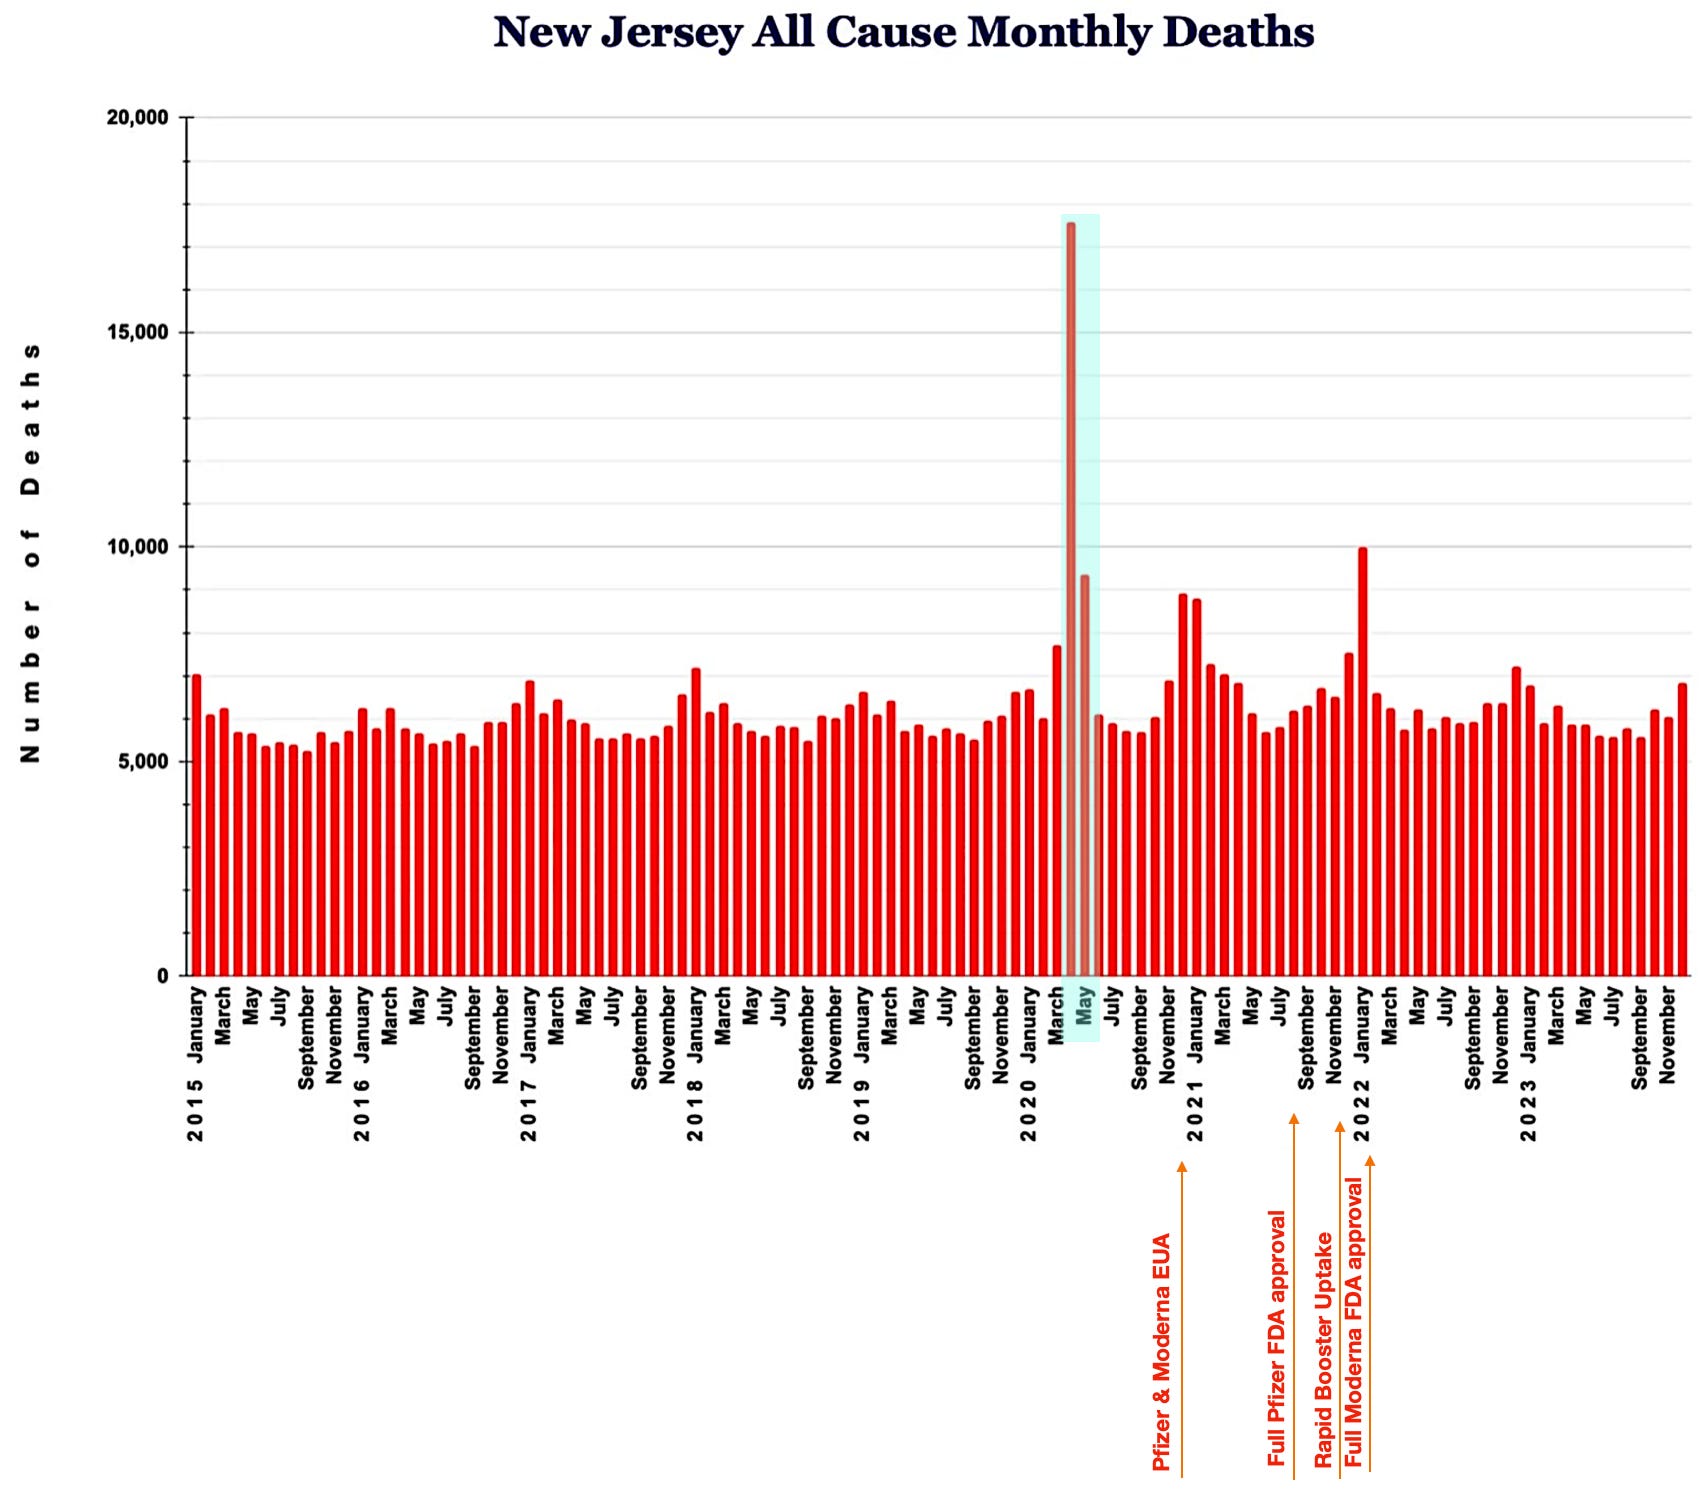
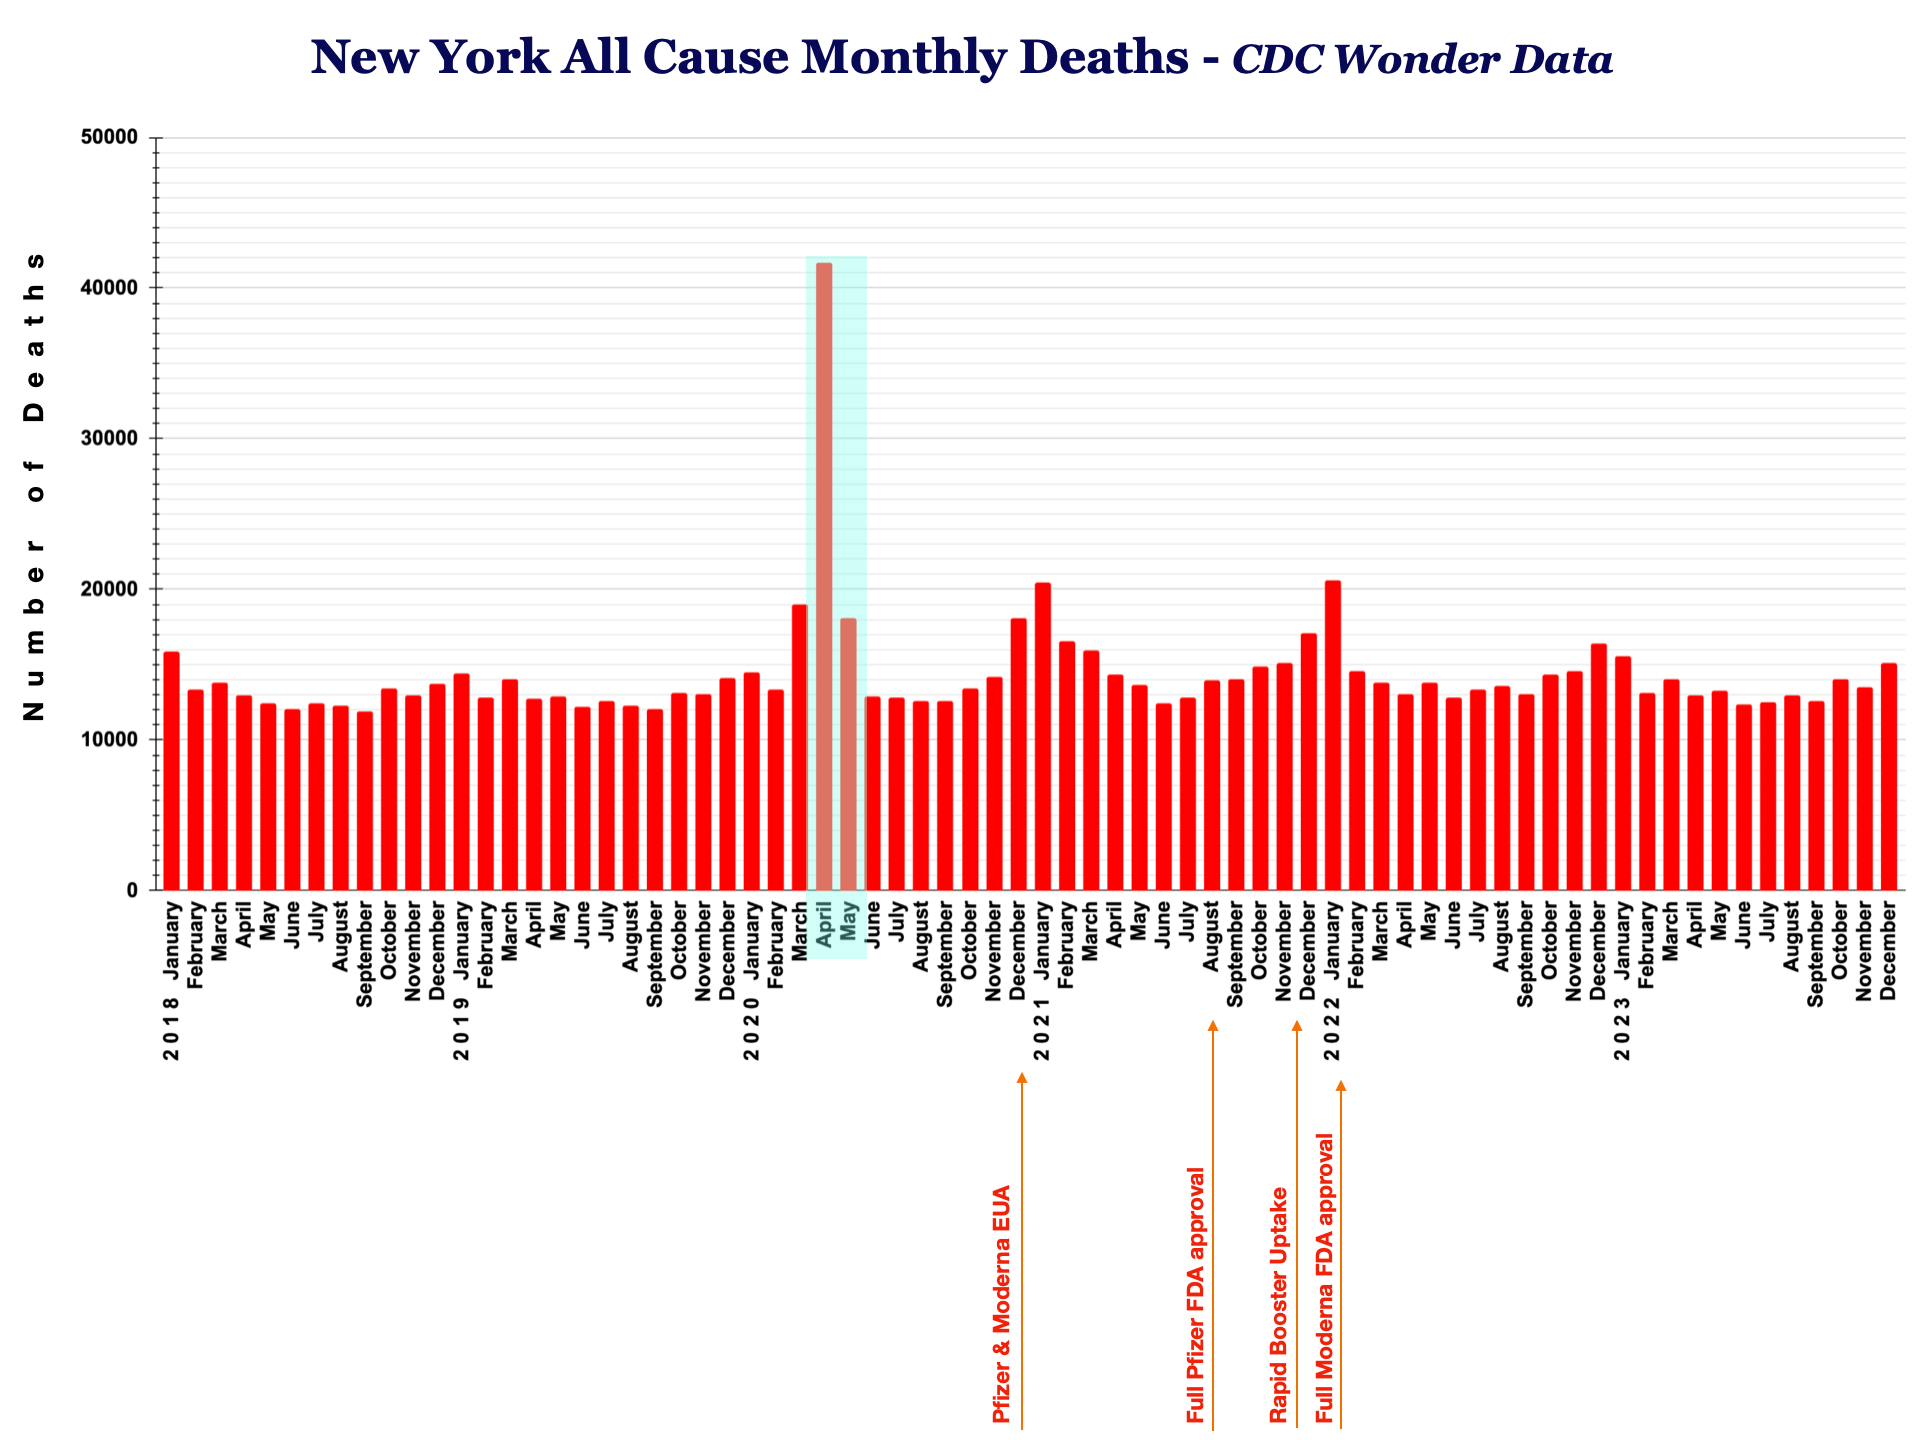
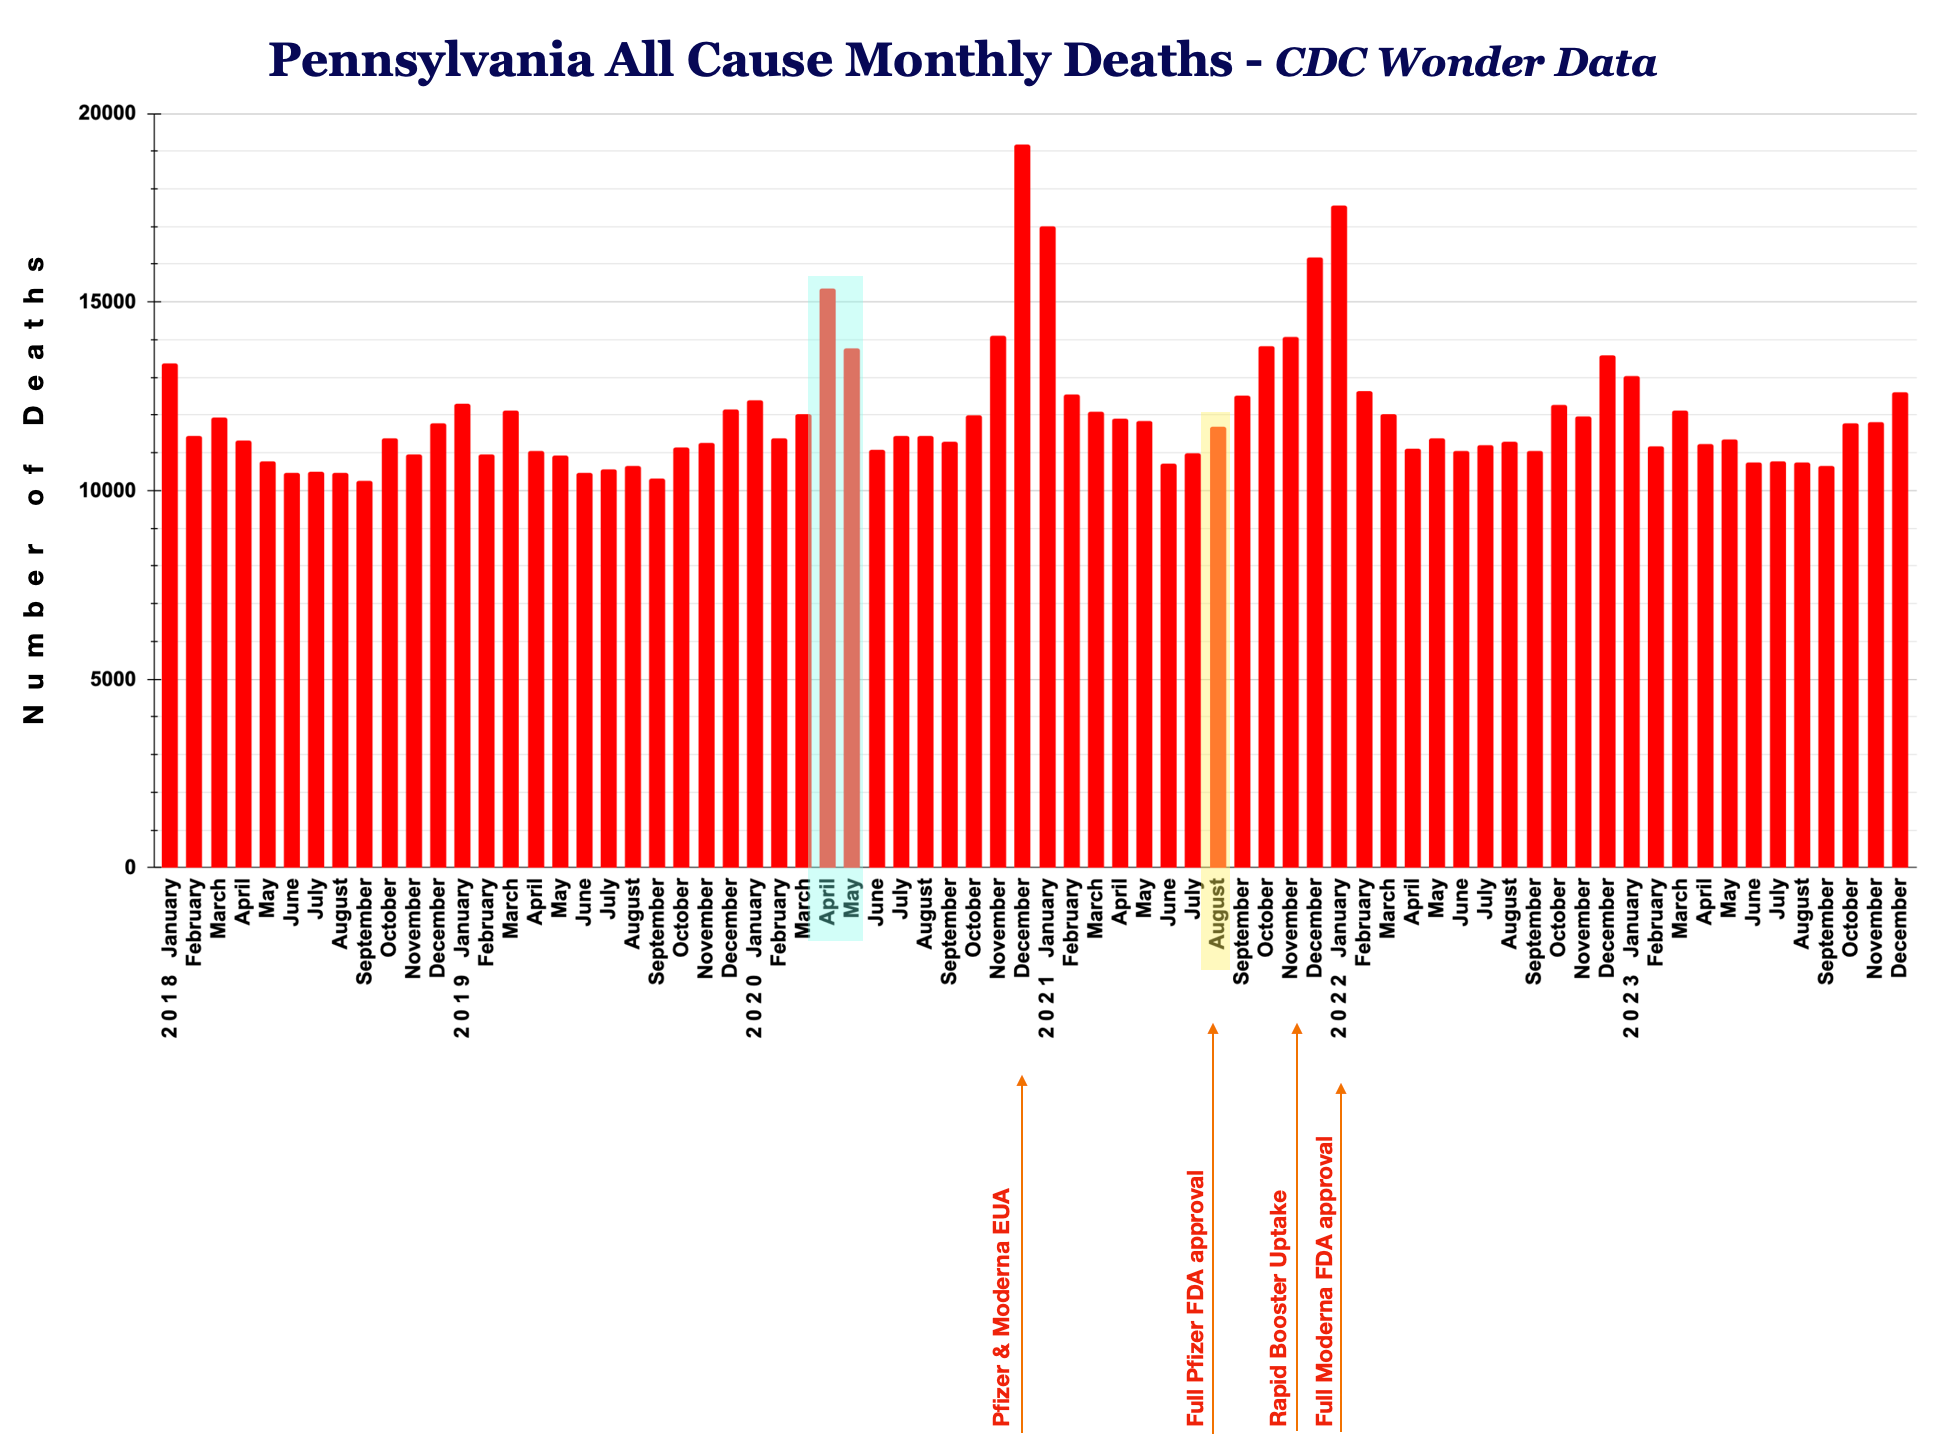
But if we reflect on where we saw some of the most explosive mortality during the pandemic, is it mere coincidence that many of those same places show up on this map as the Worst … like bottom ten bad?
.
.
.
.
.
.
.
.
Well, isn’t that convenient?
.
I think I’ll leave this topic here for the time being. I’ve got a few more things to add later though …
.
.
.
*in case you have forgotten …
Pandemic Milestones:
January 20, 2020
-First covid case in the U.S.
December 11, 2020
-Pfizer Emergency Use Authorization
December 18, 2020
-Moderna Emergency Use Authorization
August 23, 2021
-Pfizer full FDA approval
December 2021 / January 2022
-CDC and FDA revise booster recommendations
-Rapid booster uptake
January 31, 2022
-Moderna full FDA approval
August 31, 2022
-FDA authorized Pfizer and Moderna’s new bivalent COVID booster vaccines
April 10, 2023
-Biden declares the end of the pandemic
.
.
.
Thank you David. I surely will keep looking into this. It's like an onion ...
According to this paper we were doing VERY well by 2019 - maybe we were doing too well ?
"In a study published in The Lancet, researchers examined death rates from chronic, non-communicable diseases (NCDs) across 185 countries between 2001 and 2019.1 Their goal was to measure how much progress countries made in reducing early deaths from diseases like heart disease, diabetes, cancer, and chronic respiratory illness. The study calculated the probability of dying before age 80 from these conditions, which provides a clear picture of whether people are living longer, healthier lives. • Most countries saw progress, but not all — The study found that between 2010 and 2019, NCD death rates fell in about 80% of countries. That means roughly four out of five nations managed to extend lives and improve health outcomes during that time. These countries represented over 70% of the world's population, so the progress affected billions of people."
https://www.thelancet.com/journals/lancet/article/PIIS0140-6736(25)01388-1/fulltext