
Proportions
"Members Removed" % of "Rolls at End of Year"


.
FAIR WARNING. THIS IS A VERY … VERY DRY DATA GEEK OUT POST.
.
At the risk of beating a dead horse, I am going to attempt to do yet another investigation of how proportional the yearly number of pension members being removed from the rolls is to the yearly total members on the rolls. Getting to the bottom of this is pretty important at this point because of the new fiscal year pension reports that are starting to be released. It is my contention that we are still seeing evidence of harm from the coerced medical interventions that a majority of our valuable public servants agreed to let into their bodies, just to keep their jobs. Apologists for the mandates can potentially counter my claim by pointing out that generally speaking, retirement systems are continually adding new members, and thus the yearly rolls increase. Therefore it is to be expected that the members removed would also go up each year. This argument assumes that there is a fairly consistent ratio between the two sets of numbers (unless of course, we are having a “pandemic event” or something!)
It is a fair question.
.
Do we see in the numbers a return to pre-pandemic proportions?
Or do we see a sustained elevated ratio … possibly hinting at “something” still doing some harm?
.
.
.
In my last two posts examining the fresh FY2025 pension reports from Georgia and Alaska, I tried out what I deemed to be a reasonable way to assess this proportionality. In those, I simply compared the rate of change between fiscal year 2019 and fiscal year 2024. I did that analysis for both members removed and rolls at the end of year. The results seemed to show that there was a very much larger rate of increase for the members removed into 2024.
That previous Georgia result:
“So, let’s start with the roll at the end of the year numbers - 2019 compared with 2024:
52,085 to 55,133.
That is a growth of … 5.85%.
Now let’s do the same for members removed numbers - 2019 compared with 2024:
1,357 to 1,730.
That is an increase of … 27.49%.”
.
That previous Alaska result:
“So let’s investigate the proportionality for the Others. Starting with the roll at the end of the year numbers - 2019 compared with 2024:
32,845 to 35,194.
That is an increase of … 7.15%.
.
Now let’s do the same for members removed numbers - 2019 compared with 2024:
765 to 927.
That is an increase of … 21.18%.”
.
.
.
But I just kept thinking about it.
Maybe I was not getting it right yet. There had to be an elegant and simple way to get to the bottom of it.
When I first started thinking about this issue, some months ago, my initial idea was to simply take the members removed number and calculate what percentage that was of the total members. And then just do that in each year. I was disappointed with what I was seeing when I tried that because the numbers were all so small. They did not seem to be showing anything that was easily understood. This goes to show our prejudice for big things … “bigger the better”, eh?
Well guess what? That is exactly the right and fair way to do the proportional study after all. Even though those percentage numbers are small, they do show a progression, and that can be mapped … graphed.
.
I also had to figure out that the proper way to do this analysis is to take the members removed figure from one year and calculate its percentage with the previous year’s total members. Remember that those numbers are “rolls at the END of the year” - so that is the starting point for the next year to have any additions and removals. I hope that makes sense. I had to think about it for a little bit before I grasped that angle. (Did I say I am not a statistician … supposed to be an artist or something.)
Anyway, I took the time to painstakingly calculate those percentages for both Georgia and Alaska from the tables in the recent reports.
(*Though I did not give you a screenshot of the previous fiscal year’s tables from Alaska and Georgia, I did go there to record the FY2014 “rolls at the end of year” number for my calculation regarding FY2015).
.
.
.
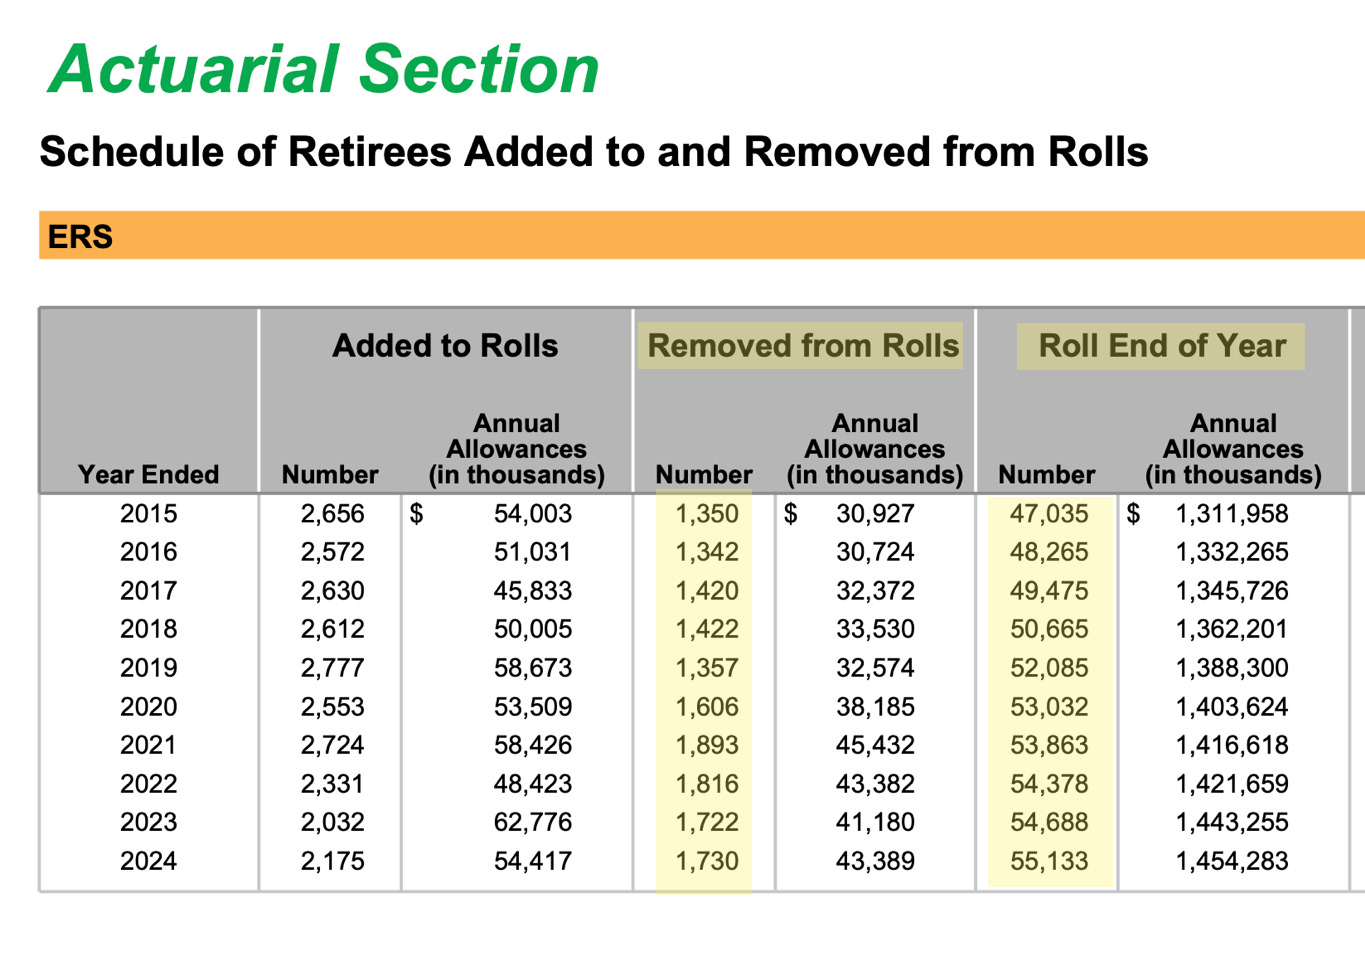
Georgia
.
.
*The percentage calculations for Georgia only used the “ERS” numbers.
.
*my table of the percentages.

.
.
.
.
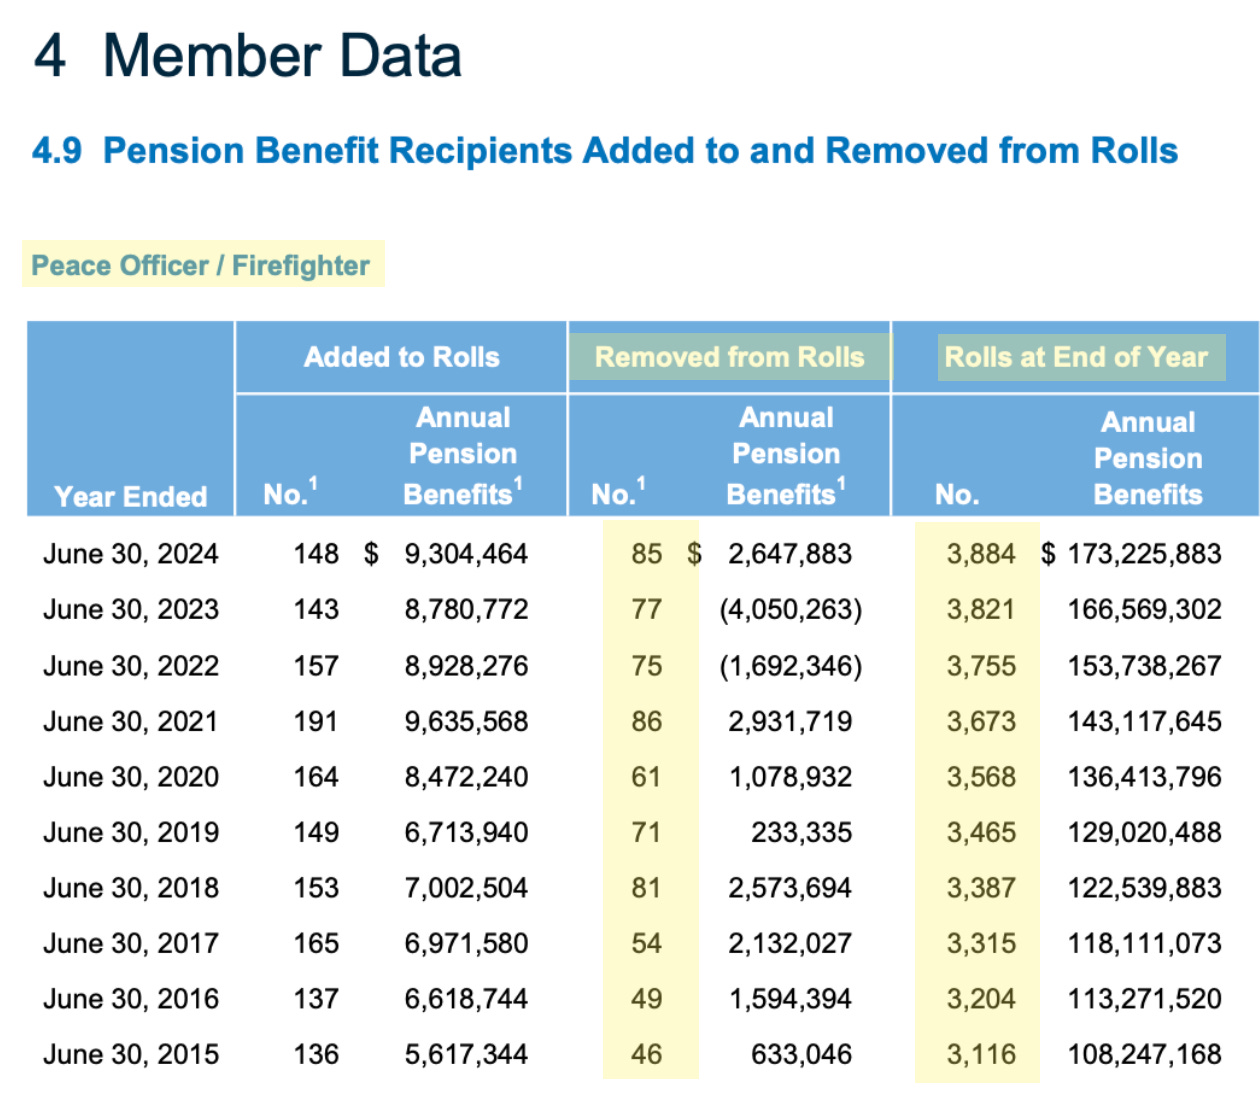
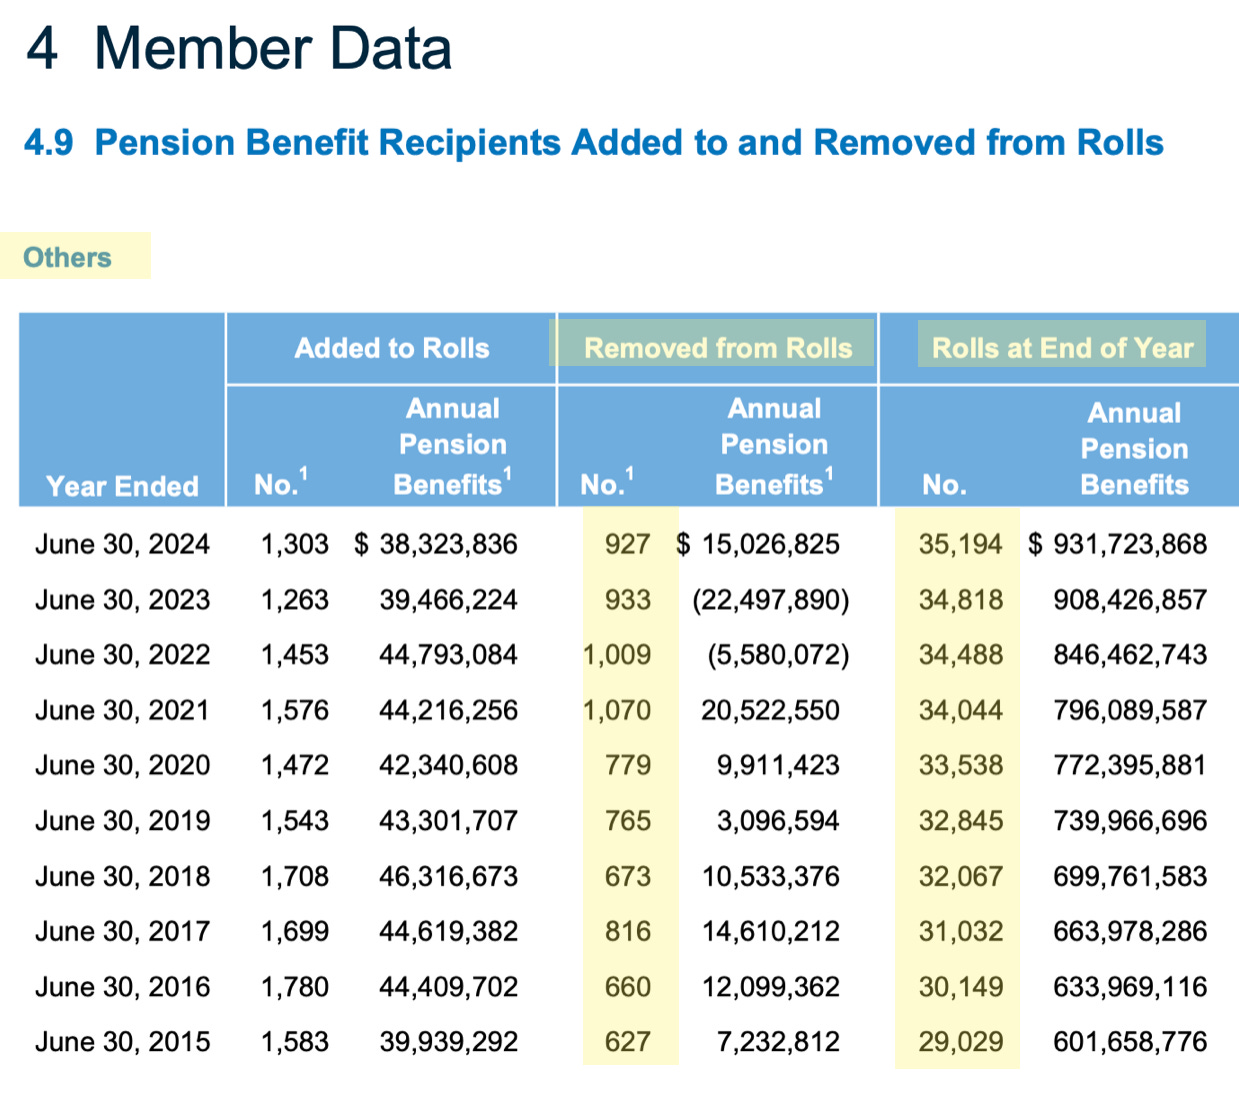
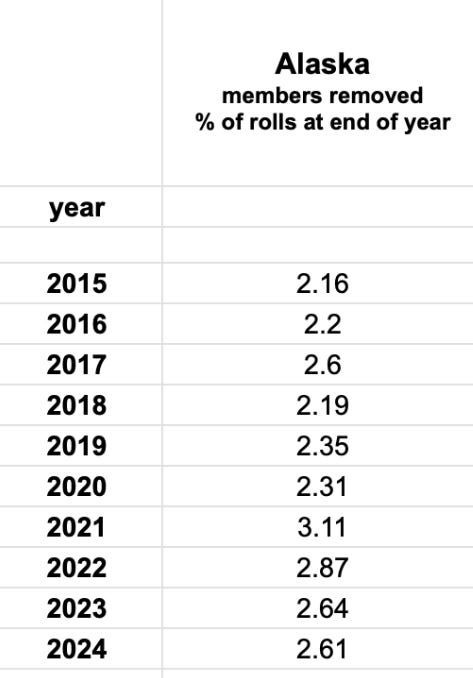
Alaska
.
.
.
*The percentage calculations for Alaska combined the two groups “Peace Officers / Firefighters” and “Others”.
.
*my table of the percentages.
.
.
As you can see, these new percentage graphs are eerily similar to the straight-up members removed graphs.
.
There is no flat line of a fixed ratio.
.
2020 and beyond, something is still causing an elevated removal of members.
.
.
.
.
.
*in case you have forgotten …
Pandemic Milestones:
January 20, 2020
-First covid case in the U.S.
December 11, 2020
-Pfizer Emergency Use Authorization
December 18, 2020
-Moderna Emergency Use Authorization
August 23, 2021
-Pfizer full FDA approval
December 2021 / January 2022
-CDC and FDA revise booster recommendations
-Rapid booster uptake
January 31, 2022
-Moderna full FDA approval
August 31, 2022
-FDA authorized Pfizer and Moderna’s new bivalent COVID booster vaccines
April 10, 2023
-Biden declares the end of the pandemic
.
.
.
I think you’re right to “simply take the members removed number and calculate what percentage that was of the total members.”
The fact that the resulting percentages confirm your earlier work -- the largest increases for Alaska and Georgia, for example, happen in 2021 -- seems to vindicate the method’s validity.
Thank you for keeping on trying to show solid numbers for what so many of us are seeing and feeling - giant holes in the fabric of our towns and communities. Something is weird........
last summer when we went to our annual city summer festival, I told my husband it seemed as though there were far fewer people than years before. Where were the jostling crowds and running kids? Had all the older crowd really passed away or become too disabled to attend?
He said, "Well, you can't see dead people".
I thank you for still digging for the truth in numbers though not being a statistician - whether by your last method of the ratio of members added to members removed or back to your first idea of tallying members removed and calculating what percentage that was of the total members.